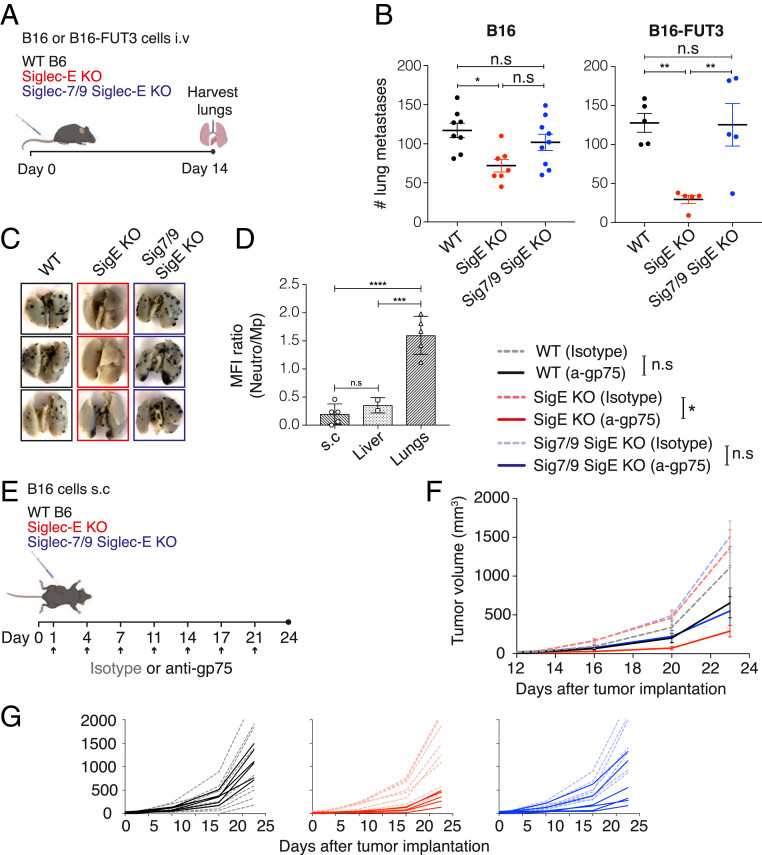
Fig. 3.
Siglec-E absence protects mice from tumor challenge and expression of Siglec-7 and Siglec-9 reverses this phenotype and potentiates tumor growth. (A) Illustration of the experimental design. Mice were inoculated intravenously with 1 × 10⁶ B16 cells or 0.5 × 10⁶ B16-FUT3 cells. Fourteen days after inoculation, mice were killed, lungs were harvested and fixed, and metastatic foci were counted. (B) Number of B16 (Left) or B16-FUT3 (Right) metastatic foci in the lungs of WT C57BL/6 (black), Siglec-E KO (red) or Siglec-7/9/Siglec-E KO (blue) mice. Each circle represents an individual mouse. Graph shows a representative experiment (n = 3 experiments). Data are displayed as mean ± SEM. (C) Representative images of lungs excised from the indicated mouse strains 14 d postinoculation with B16-FUT3 cells. (D) Relative Siglec-E expression between neutrophils and macrophages in WT C57BL/6 mice, presented as Siglec-E MFI ratio in B16-FUT3 tumors located in different organs (subcutaneous, liver or lungs). (E) Illustration of the experimental design. Mice were inoculated subcutaneously (s.c.) with 0.2 × 10⁶ B16 cells, and treated with 200 μg of anti-gp75 antibody or an isotype-matched control on the indicated days (arrow). Tumor volume was measured twice weekly using a digital caliper. (F) Tumor growth of B16 cells in WT C57BL/6 (black), Siglec-E KO (red), or Siglec7/9/Siglec-E KO mice (blue). Solid lines represent groups treated with anti-gp75 antibody, while dashed faint lines represent groups treated with an isotype control. Average sizes of primary tumors ± SEM are presented in cubic millimeters (mm3; n = 5 to 9 mice per group). (G) Tumor growth curves of individual mice from (F). *P < 0.05; **P < 0.01; ***P < 0.005; ****P < 0.0001; ns, nonsignificant (one-way ANOVA).

