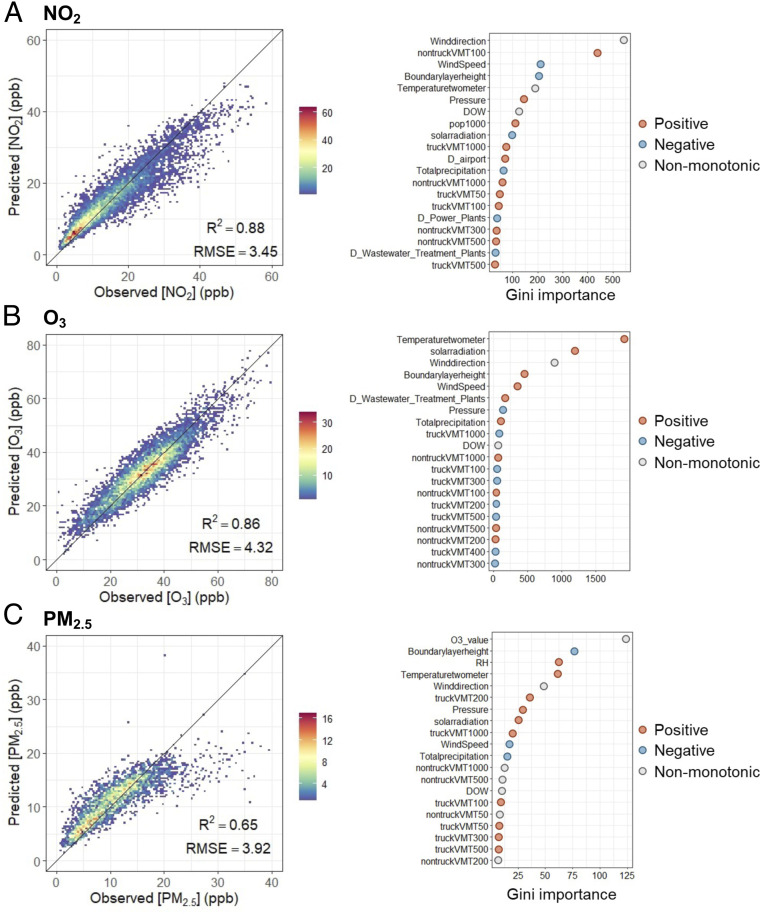
Fig. 1.
Model performance and variable importance for three species: (A) NO2, (B) O3, and (C) PM2.5 in LA. Cross-validated model R2 and RMSE are calculated by using a fivefold cross-validation modeling performance for 24-h average concentrations. The color indicates the sample size for each dot. The variables are listed in order of importance from top to bottom. The horizontal axis represents the Gini index from the RF model. A larger value represents higher importance. The definitions of all predictors are provided in SI Appendix, Table S2.

