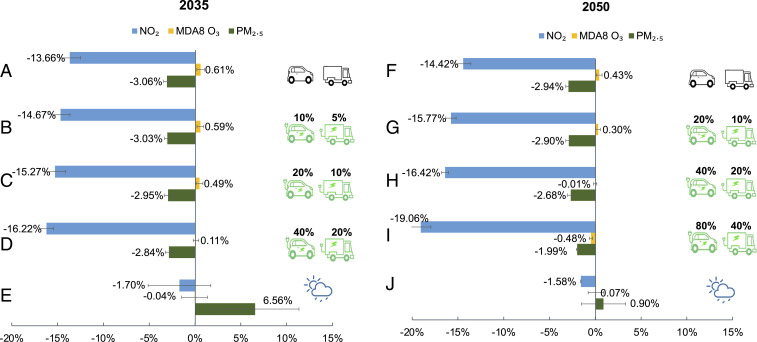
Fig. 4.
Reduction ratios of NO2, MDA8 O3, and PM2.5 concentrations under different traffic scenarios in 2035 and 2050 relative to 2019. A and F represent baseline traffic emission scenarios from EMFAC; B–D and G–I represent three electrification scenarios; E and J future climate change scenarios in 2035 and 2050, respectively. The error bars represent uncertainty of model predictions calculated by the Monte Carlo method. Random sampling was repeated for 100 times considering uncertainty of each variable in prediction of each scenario.

