Fig. 1.
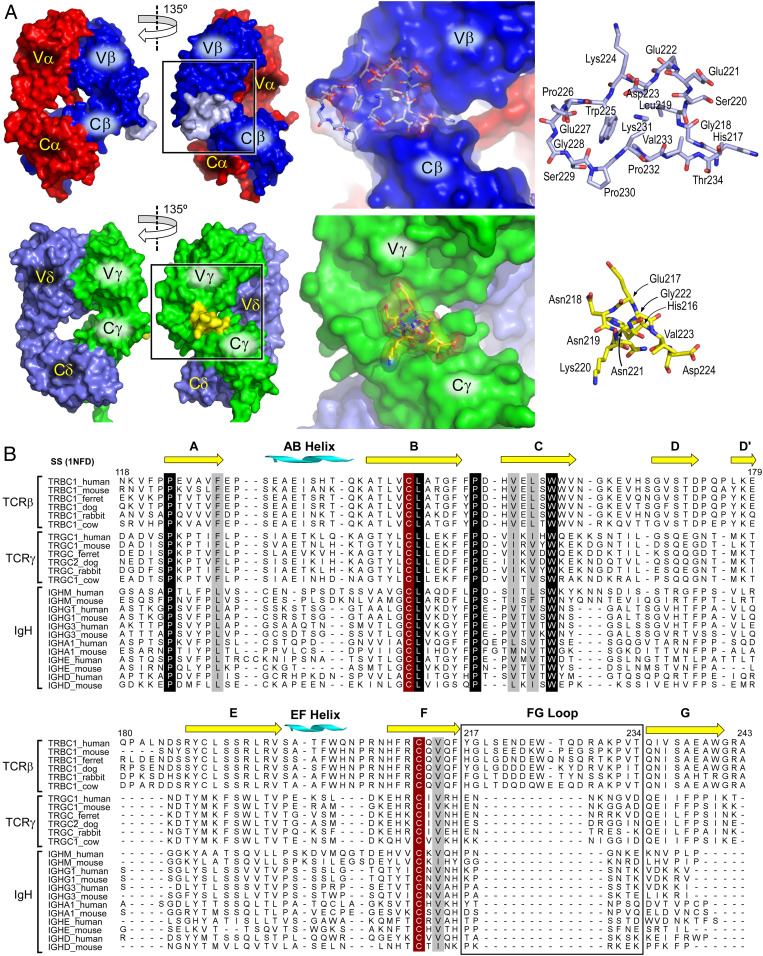
Structural features of γδ and αβTCRs. (A) Structural comparison of TCRαβ (Top) with TCRγδ (Bottom). The Left two panels in each row show surface representations with individual subunits and domains delineated. The FG loop is shown in light blue (TCRαβ) or yellow (TCRγδ) and highlighted in the boxed region. The Right two panels of each row present a zoomed view of the boxed region at approximately the same magnification for each TCR to illustrate the relative size and structure of the respective FG loops. (B) Multiple sequence alignment of mammalian TCR Cβ, Cγ domains, and equivalent Ig CH1 domains of selected isotypes. Secondary structure as assigned in the murine N15αβ X-ray structure 1NFD are indicated. The FG-loop region is boxed. Invariant cysteines are highlighted in red-brown and conserved residues denoted in black and gray.

