Fig. 5.
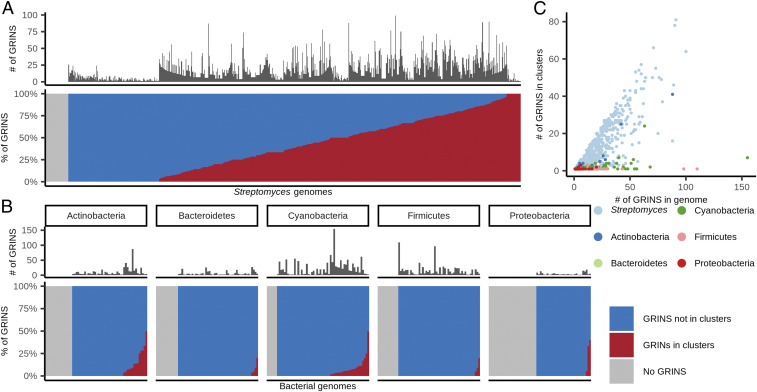
GRINS in bacterial genomes. (A) Distribution of GRINS in 803 Streptomyces high-quality nonredundant genomes. (Upper) Each bar/sliver is a genome; the dark bars show the number of detected GRINS in the corresponding genome. (Lower) The fraction of GRINS that overlap with biosynthetic gene clusters (red) versus those that do not overlap with such clusters (blue). Genomes without GRINS appear gray in this plot. (B) Distribution of GRINS among 300 bacterial genera from five phyla. The plot is similar to A, Lower, but each genome represents a unique genus from the corresponding phylum. (C) Streptomyces-specific enrichment of GRINS in biosynthetic gene clusters. Each point is a genome, and color indicates the taxonomic group of each genome. Only for Streptomyces bacteria does the number of GRINS in biosynthetic gene clusters (y axis) increase with the number of GRINS in a genome (x axis).

