
Figure 1.
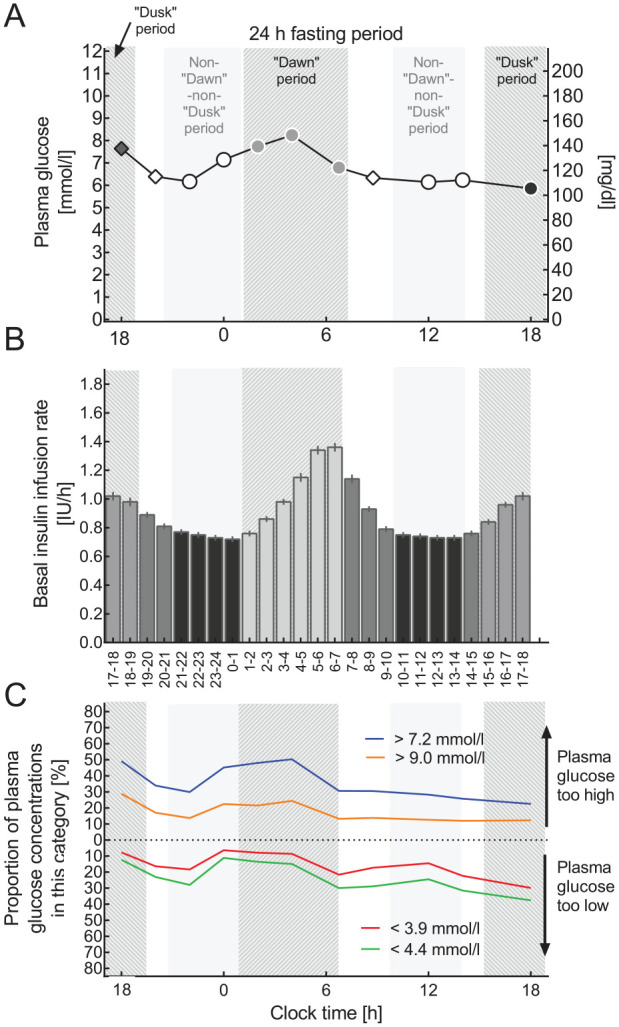
Basal insulin infusion rate profiles and results of 24-hour fasting periods performed as a basal rate test. (A) Plasma glucose profiles during 24-hour fasting periods, (B) the current hour by hour basal insulin infusion profile (IU/h), and (C) proportions of patients with plasma glucose concentrations below thresholds indicating “below the target range” or hypoglycemia (<4.4 or <3.9 mmol/L, respectively) or above thresholds indicating “above the target range” or hyperglycemia (>7.2 or >9.0 mmol/L. (A, B) Means ± standard error of the mean and (C) % of all plasma glucose values available for this time point. Light gray bars highlight the periods of the day as defined for the purpose of the present analysis. The “dawn” period from 01:00 to 07:00 am, the “dusk” period from 03:00 to 07:00 pm, a reference period with a peak-less, flat insulin basal rate profile (10:00 am to 02:00 pm and 08:00 pm to 01:00 am, non-“dawn”-non-“dusk” period). Plasma glucose concentrations are shown with different symbols if belonging to one of these predefined periods of the day. Time points 08:00 pm and 08:45 am were considered not to belong to any of these predefined periods.