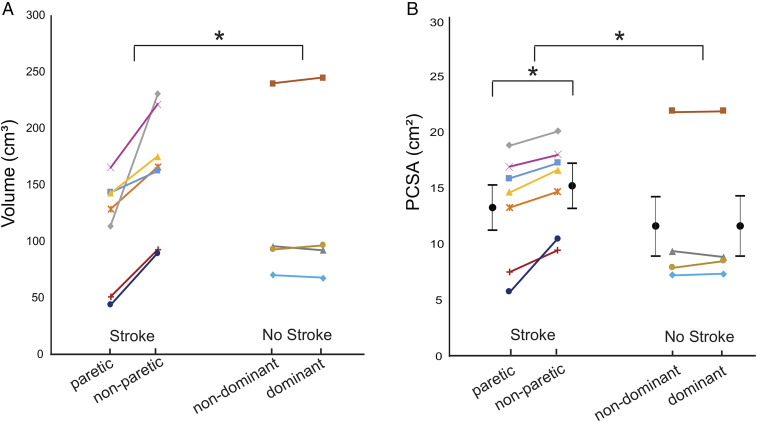
Fig. 3.
Muscle volume and PCSA. Biceps brachii muscle volume (with intramuscular fat removed) (A) and calculated PCSA (see Eq. 6) (B) for both limbs of all participants who had a stroke and the age-matched controls (no stroke). The average of the parameter values for each individual participant is represented by a symbol of different shape and or color. Each individual’s limbs are connected by a solid line. Black filled circles and error bars which are offset from individual participant data represent mean and SE estimated of PCSA from the GLMM. In A, the asterisk (*) indicates a significant difference in muscle volume across groups (stroke versus no stroke) established from implementing the Mann–Whitney U test (P < 0.05). In B, the asterisk (*) indicates a significant difference either across (stroke versus no stroke) or within groups (i.e., paretic versus nonparetic) in PCSA estimated from the GLMM (P < 0.05).

