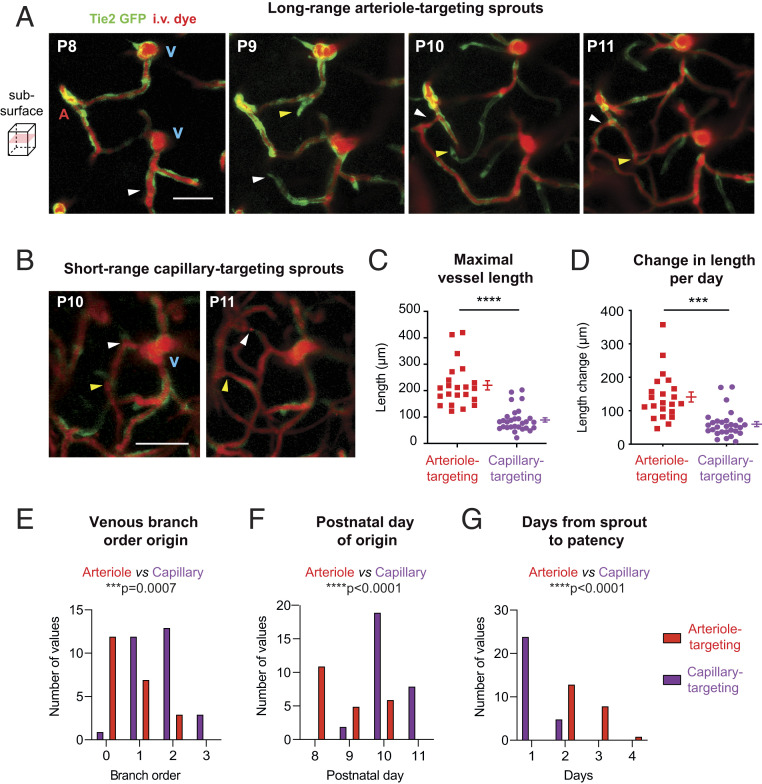
Fig. 4.
Distinct spatiotemporal dynamics of venule-derived sprouts that target arterioles vs. capillaries. (A and B) Representative images of long-range arteriole-targeting sprouts (A) and short-range capillary-targeting sprouts (B). Arrowheads correspond to two examples (white or yellow) for each sprout type. (Scale bar: 50 μm.) A, artery; V, vein (also see SI Appendix, Fig. S10). (C–G) Different features of arteriole-targeting and capillary-targeting sprouts according to their connection target. Maximal vessel length: ****P < 0.001, t(14) = 5.980. Change in length per day: ***P = 0.0006, t(14) = 4.409. Venous branch order: ***P = 0.0007, t(14) = 4.298. Postnatal day origin: ****P < 0.0001, t(14) = 6.141. Days from sprout to patency: ****P < 0.0001, t(14) = 6.874 (paired t test). Data are presented as mean ± SEM (n = 51 sprouts from four mice).

