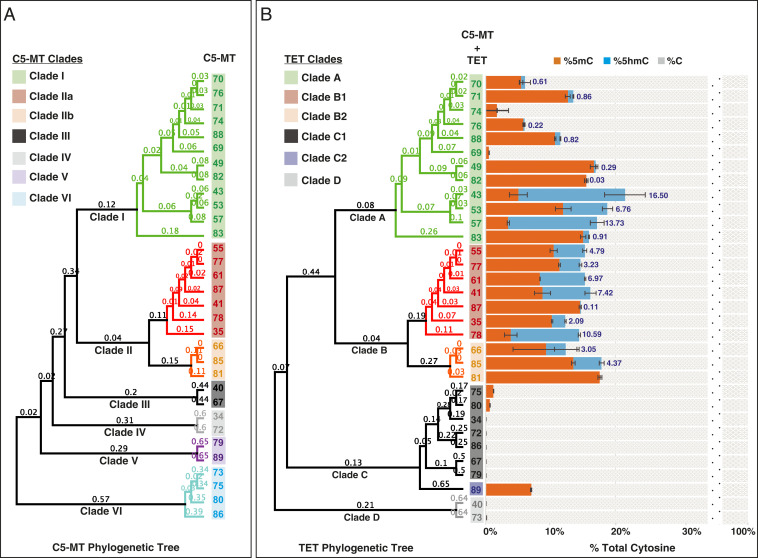
Fig. 3.
(A) Phylogenetic analysis of C5-MTs by their amino acid sequences. (B) Phylogenetic analysis of TETs by their amino acid sequences (Left) and LC-MS/MS data of percent cytosine species formed in vivo on E. coli gDNA upon coexpression of C5-MT and TET from a specific contig as indicated by the contig number (Right). The data labels reflect the percent 5hmC formed per total cytosines as a result of the activity of the TET tested. Error bars represent the SD, n = 2.

