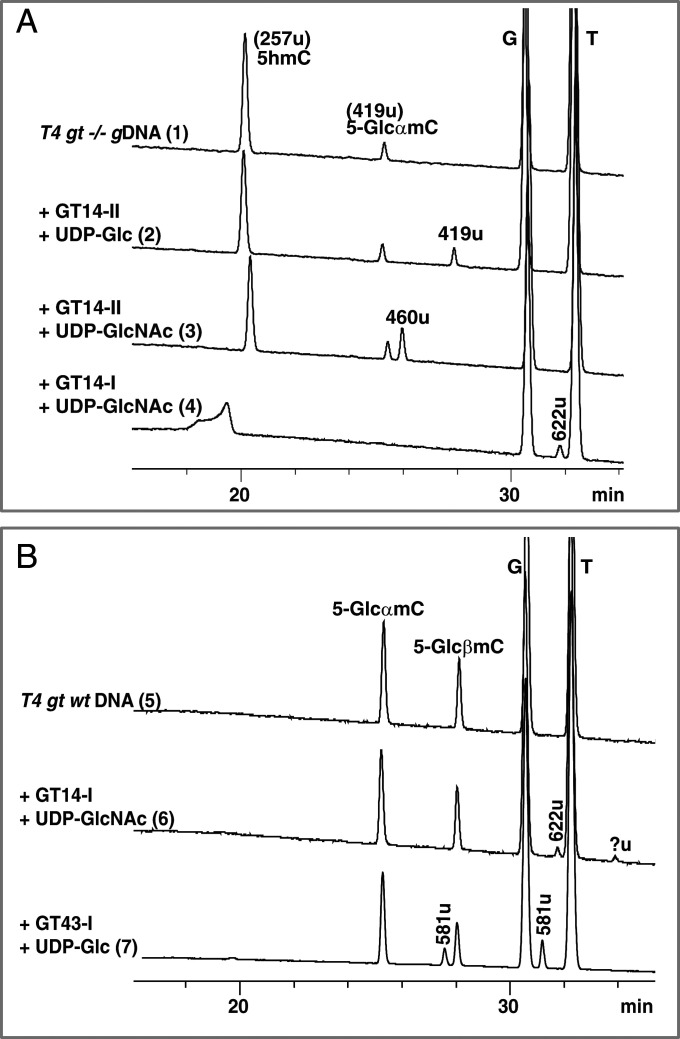
Fig. 7.
LC-MS analysis showing the (A) in vitro activity of purified GTs in the presence of UDP-sugar and T4 phage gt−/− DNA (traces 1 through 4) or (B) T4 phage wt DNA (traces 5 through 7). Nominal masses are labeled for each peak and further described in the text. Experimental details are described in SI Appendix, SI Materials and Methods.

