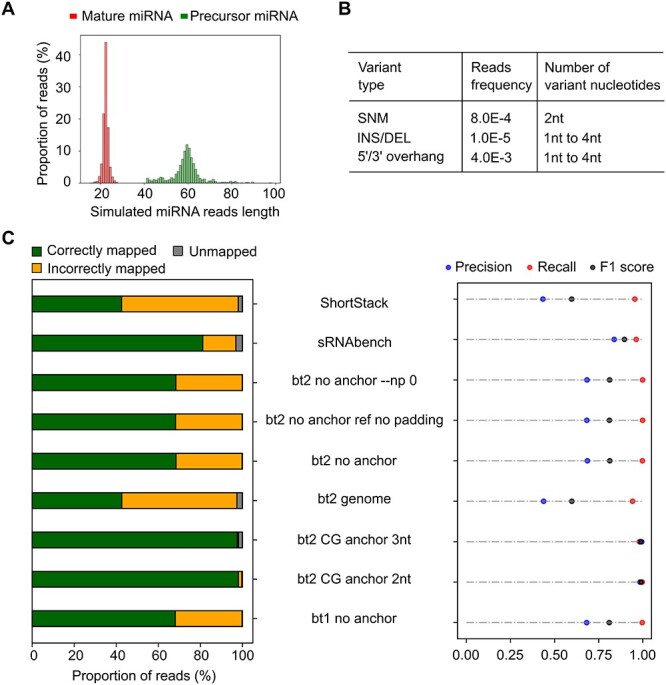
Figure 4 .

Performance comparison of miRNA alignment methods with realistic simulated miRNA reads. (A) Length distribution of the reads set, including mature miRNA (red) and precursor miRNA (green). (B) Reads variation profile of the read sets containing SNM, INS/DEL, and 5′/3′ overhang. (C) Assessment of alignment methods by percentage of correctly mapped reads (green), incorrectly mapped reads (yellow), and unmapped reads (grey) (left panel) and precision (correctly mapped/(correctly mapped + incorrectly mapped)), recall (correctly mapped/(correctly mapped + unmapped)), and F1 score.
