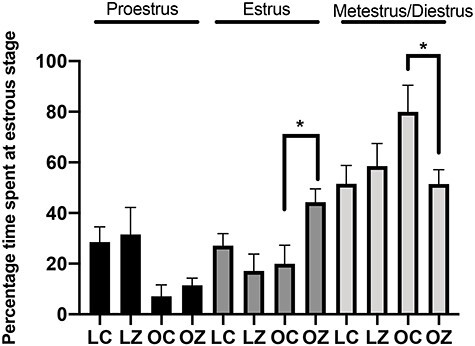
Figure 3.

Estrous cyclicity impacts of obesity and ZEN exposure. The number of days at each stage of the estrous cycle were calculated over a 14-day period and presented as a percentage. Bars represent percentage of d at proestrus (black bars), estrus (dark gray bars), and metestrus + diestrus (light gray bars) ± SEM. Asterix indicates differences between treatments; P < 0.05; n = 5/treatment. Lean control-treated mice = LC; lean zearalenone-exposed mice = LZ; obese control-treated mice = OC; obese zearalenone-exposed mice = OZ.
