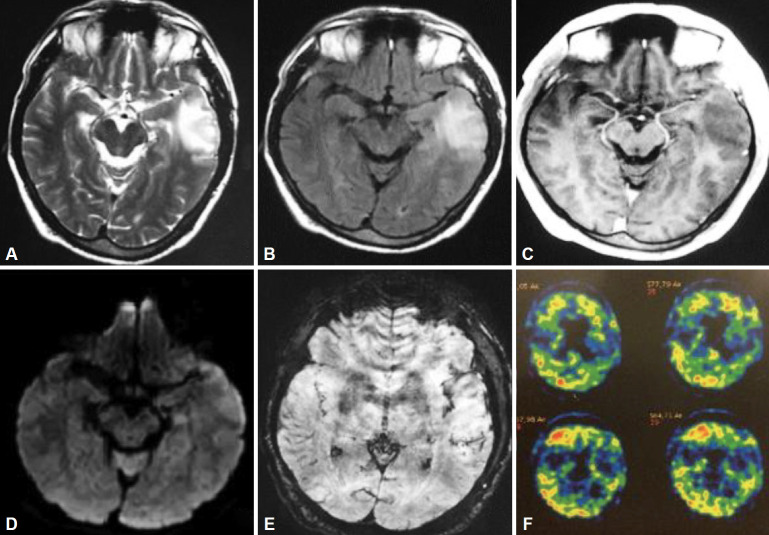
Figure 1.
Left anterior temporal lesion with mass effect shows high signal in T2 W (A) and FLAIR (B) and hypointensity in T1W, with lack of contrast enhancement (C). High signal in DWI sequence (D) and ADC map (not shown) is due to vasogenic edema. Scattered intralesional foci of microhemorrhages can be seen in SWI (E). C-PiB PET: Extensive and bilateral cortical deposits of Beta amyloid (F). MRI: magnetic resonance imaging, DWI: diffusion-weighted magnetic resonance imaging, FLAIR: T2-weighted-Fluid-Attenuated Inversion Recovery, ADC map: apparent diffusion coefficient, C-PiB PET: C-Pittsburgh compound B Positron Emission Tomography.

