Figure 3.
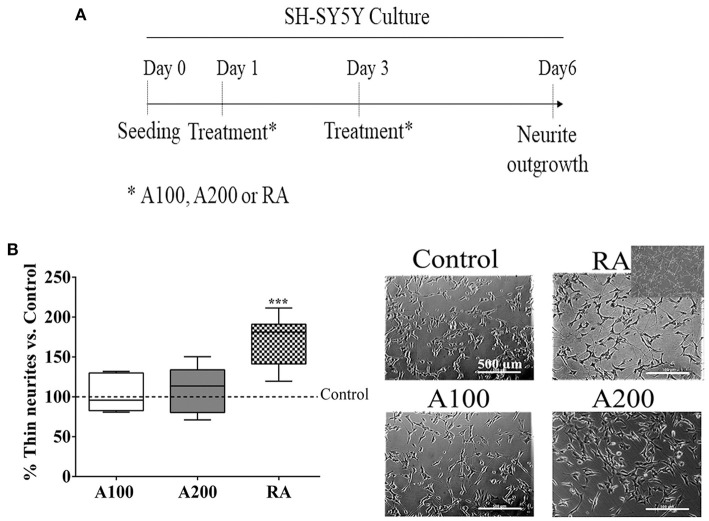
SH-SY5Y neurite differentiation: (A) timeline of the experimental procedure. (B) Box plots and representative images showing axonal/neurite outgrowth in the presence of Retinoic Acid (RA) as expected, but not with angiogenin stimulation; n = 5–6. The insert in RA shows a micrograph representative of the WimNeuron analysis. Box plots represent median (IQR) of the percentage vs. control values of each independent experiment, ***p < 0.001 vs. control.

