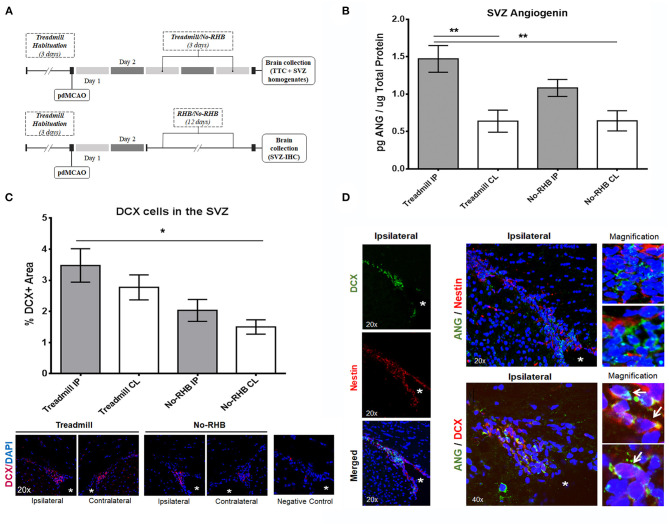
Figure 4.
Post-stroke SVZ neurogenesis and angiogenin expression: (A) timeline schemes describing the pre-clinical stroke and treadmill rehabilitation protocols. (B) Bar graph representing angiogenin after 3 days of treadmill rehabilitation or no rehabilitation in the SVZ area, measured by ELISA (n = 6/group); (C) bar graph representing DCX+ quantification in the immunohistochemistry study of the SVZ (n = 5/group) and representative immunostains of the ipsilateral hemisphere identifying the neuroblasts (DCX+). (D) Representative immunostains of the SVZ after stroke and treadmill exercise showing the distribution of nestin+ and DCX+ NSCs in the SVZ (left panel); notice that only neuroblasts (DCX+) had the most angiogenin expression, which is specifically shown in the insert magnifications and in white arrows. Bar graphs represent mean ± SEM, *p < 0.05 and **p < 0.01 as indicated by the horizontal lines. ANG, angiogenin; CL, contralateral; DAPI, 4′,6-diamidino-2-phenylindole; DCX, doublecortin; IP, ipsilateral; RHB, rehabilitation; SVZ, subventricular zone. The white * indicates the position of the lateral ventricle with contiguous dorsolateral SVZ.

