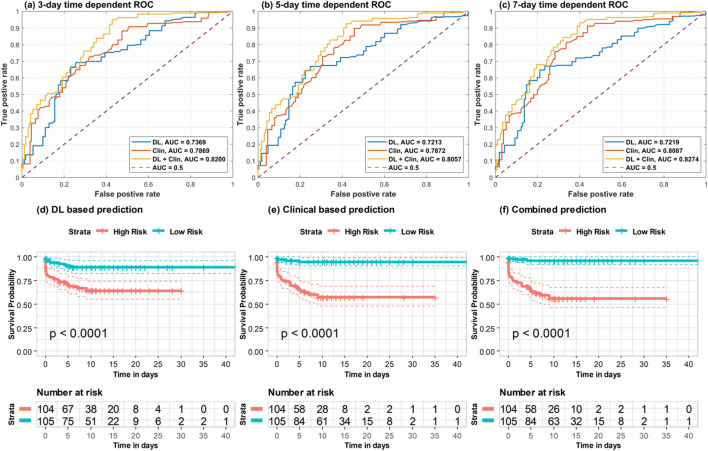
Fig. 4.
Time-dependent ROC-AUCs and risk stratified subgroup survival curves based on deep learning (DL) features extracted from top lung slices. a–c Time-dependent ROC curves and AUCs with different cutoff values (3-day, 5-day, and 7-day). d–f The risk-stratified survival curves based on DL-based progression prediction, clinical-based progression prediction, and combined progression prediction. The y-axis is survival probability representing the probability of not progressing to critical event. The “+” in survival curves denotes the censored patient. Risk tables of these stratification results are also listed in the bottom of this figure

