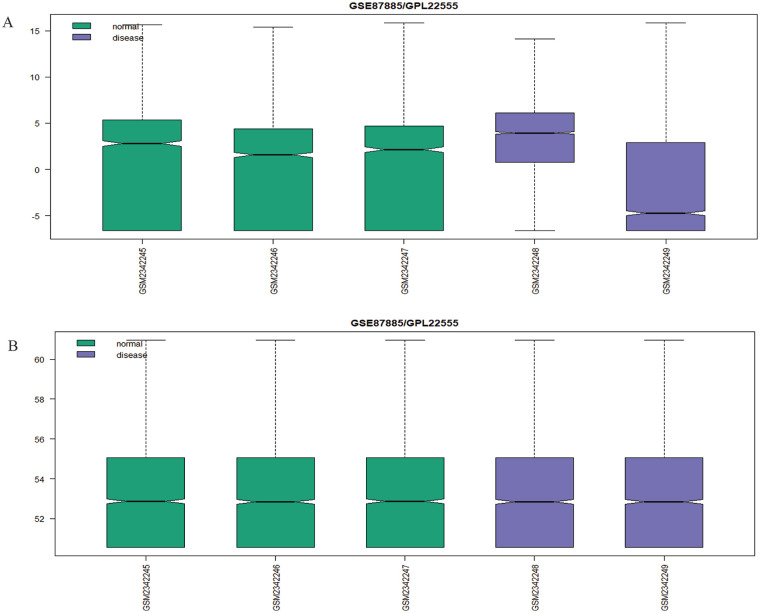
Figure 2.
Boxplot indicating the expression values in the GSE series data sets. If the data sets are not normalized, it shows false results (the value of log fold change varies) of the probe expression due to noise, duplicity, and redundancy so that normalization of data sets is required. (A) Prenormalization of GSE87885 where green color indicates normal samples (GSM2342245, GSM2342246 and GSM2342247) and violet color for disease samples (GSM2342248 and GSM2342249). (B) Normalized data sets.

