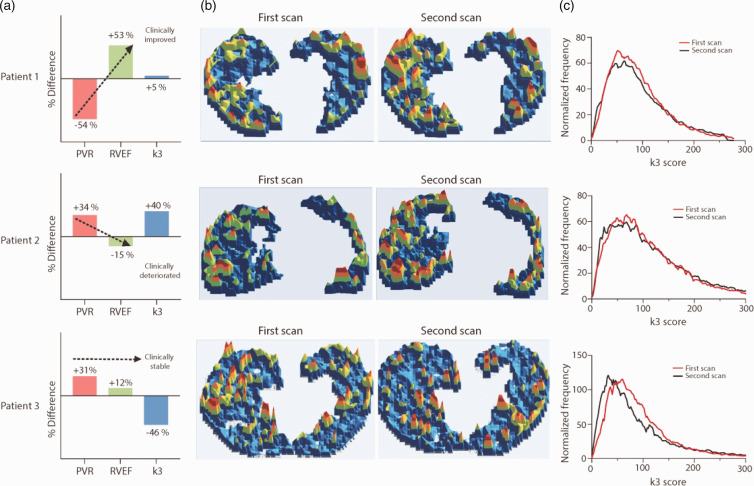
Fig. 3.
(a) % Difference in pulmonary vascular resistance (PVR), right ventricle ejection fraction (RVEF) and k3 phosphorylation rate (k3) in follow‐up scans from three PAH patients. (b) 3‐dimensional parametric map (axial view) generated from computed per‐voxel 18FLT lung uptake. Uneven regional 18FLT uptake was observed in all patients (blue colour = base line, green = low, yellow = mid and red = high). (c) Comparative histogram distribution of voxel wise FLT phosphorylation score for first and second scan.
PVR: pulmonary vascular resistance; RVEF: right ventricular ejection fraction.

