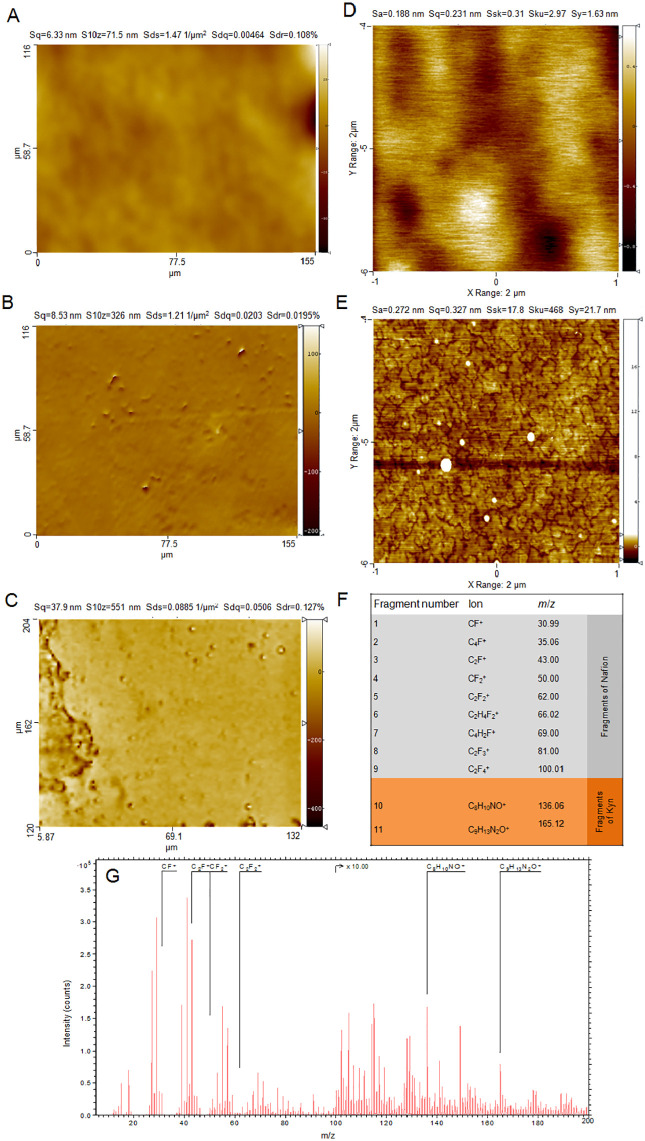
Figure 3.
Morphology of the bare GCE (A) and GCE (B) modified with the Nafion layer (Nafion/GCE) determined by optical profilometer; scanning area: 77.5 × 58.1 µm2. (C) Optical profilometer micrographs of the Nafion/GCE surface after Kyn accumulation; scanning area: 84 × 126 µm2; roughness parameter: Sq = 37.9 nm. AFM micrographs of (D) the Nafion/GCE surface (Sq = 0.23 nm) and (E) the Nafion/GCE surface after Kyn accumulation (Sq = 0.627 nm); scanning area: 2 × 2 µm2 (256 × 256 pixels). Kyn concentration in the supporting electrolyte was 2 µM (accumulation potential and time: +0.5 V, 60 seconds). Drop (1.0 µL) of Nafion solution (0.5%, w/v) was placed onto GCE surface. The most characteristic positive ions for Nafion and Kyn identified in TOF-SIMS spectra (F) and an example of TOF-SIMS spectra obtained for the Nafion/GCE after Kyn accumulation for 60 seconds (G) are shown.

