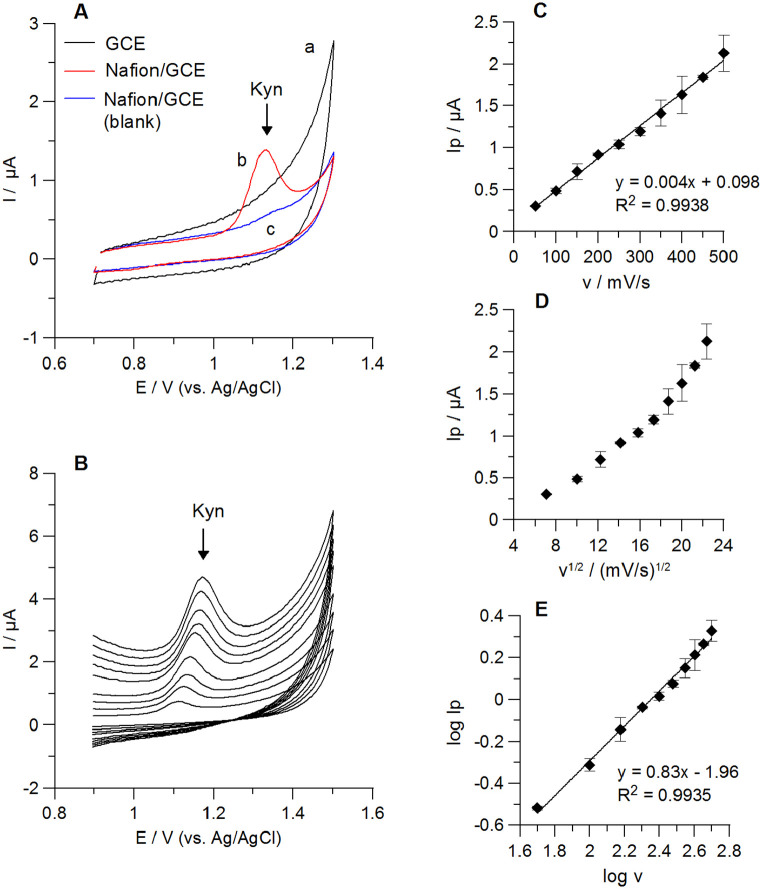
Figure 5.
Cyclic voltammetric (CV) results of 2 µM Kyn in 0.1 M H2SO4. CVs of Kyn at the bare GCE (a) and the Nafion/GCE (b) are shown in panel (A). Curve c: the Nafion/GCE in blank solution; scan rate: 100 mV/s. Panel (B): CVs of Kyn at the Nafion/GCE obtained for different scan rates (50-500 mV/s). Relationships between Kyn anodic peak currents (Ip) and the scan rates (v) (panel (C)) or square root of the scan rates (v1/2) (panel (D)) at the Nafion/GCE are presented. Regression of the logarithm of the Kyn peak currents (log Ip) and the logarithm of the scan rates (log v) is shown in panel (E).

