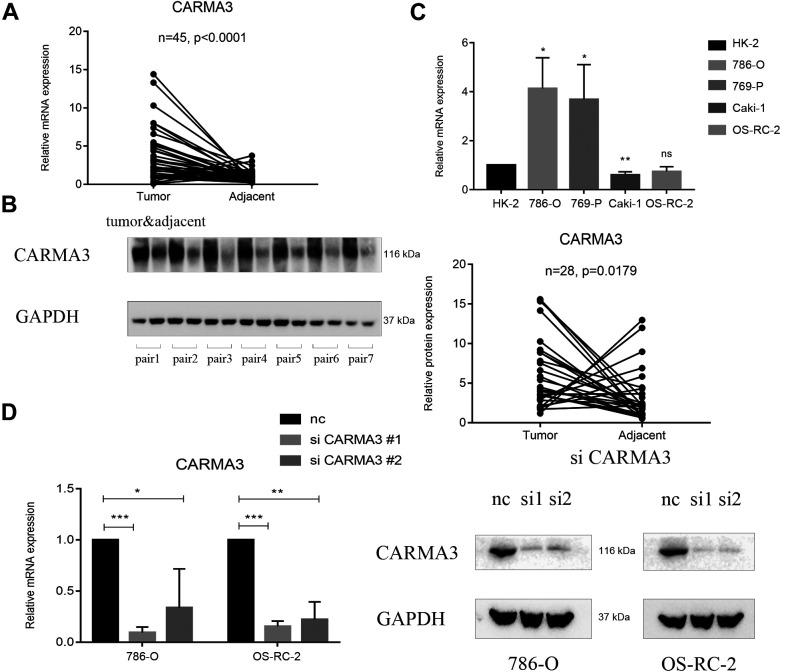
Figure 1.
Expression of CARMA3 in clear cell renal cell carcinoma (ccRCC) samples and cells. A, Reverse-transcription polymerase chain reaction (RT-PCR) analysis of the CARMA3 expression level in 45 ccRCC samples paired with normal tissues. B, Western blot analysis of the CARMA3 expression level in 45 ccRCC samples paired with normal tissues, shown in partial examples and statistical plots. C, RT-PCR analysis of the CARMA3 expression level in ccRCC cell lines and normal renal tubular epithelial cells. D, RT-PCR and western blot analyses of the CARMA3 expression level in CARMA3-shRNA-knockdown ccRCC cells. *P < 0.05, **P < 0.01 and ***P < 0.001.

