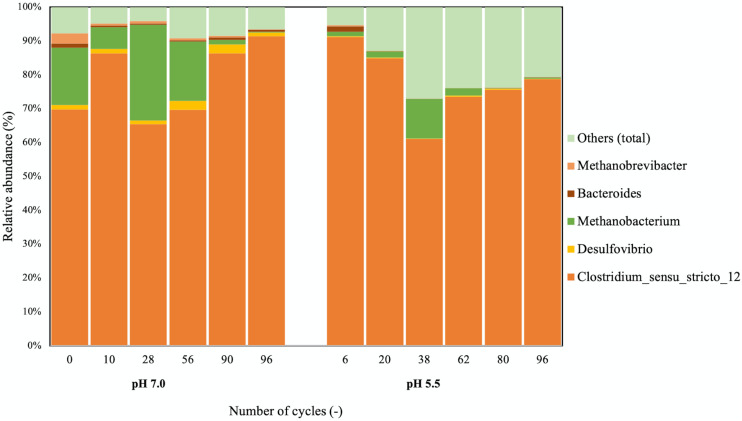
FIGURE 2.
Taxonomic distribution of the microbial communities at pH 7.0 and 5.5. 16S rRNA amplicon sequencing was used to assess the community composition. All samples had a similar number of total reads. OTUs constituting less than 3% of the community were grouped under “Others.” On the x-axis, the number of cycles after which the sample was taken from the bioreactor is displayed for each sample.

