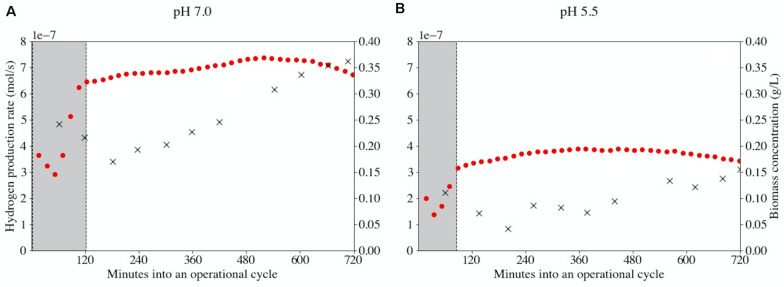
FIGURE 3.
Bioreactor-specific hydrogen production rates (•) and biomass concentrations (×) at pH 7.0 (A) and pH 5.5 (B) during operational cycle 92. The physicochemical (abiotic) behavior of the reactor was modeled in order to accurately predict the biological activity responsible for the observed gas profiles. Areas shaded in gray indicate the initiation of a new cycle and its associated uncertainty in measurements due to a temporarily changing physiochemistry. This uncertainty is mainly related to incorrect prediction of CO2 speciation. The period of uncertainty is shorter at pH 5.5 (90 min versus 120 min) as less CO2 dissolves at this pH.

