FIGURE 1.
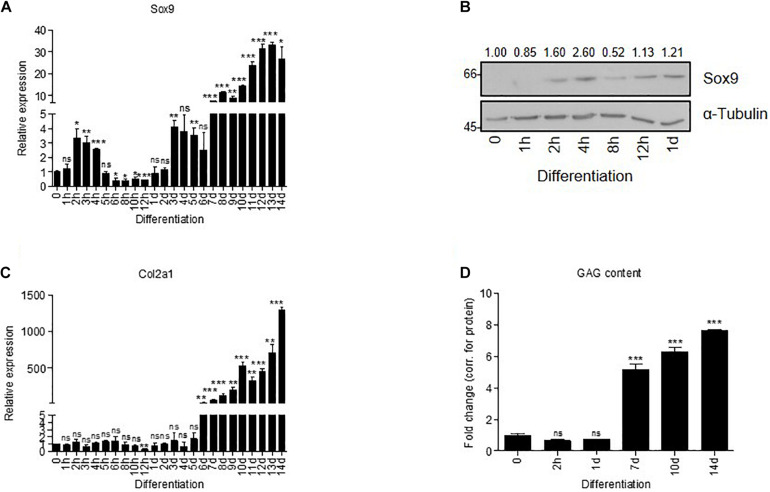
Sox9 expression has a bi-phasic peak expression during chondrogenic differentiation of ATDC5 cells. (A) Sox9 mRNA expression showed bi-phasic peak pattern during ATDC5 differentiation (h = hours, d = days) as measured by RT-qPCR (Caron et al., 2012; Spaapen et al., 2013). Results were normalized to β-Actin mRNA expression and presented relative to t = 0. (B) Sox9 protein expression peak during early ATDC5 differentiation as measured by immunoblotting. α–Tubulin was used as loading control. Molecular weight markers (in kDa) are shown on the left and relative quantifications are depicted on top of immunoblot. (C) In similar samples from (A), Col2a1 mRNA expression was measured during ATDC5 differentiation by RT-qPCR and showed an increase in expression from day 6 onward. (D) GAG content (by Alcian Blue staining and corrected for total protein expression) was determined during ATDC5 differentiation. Experiments were performed in triplicate, bars represent mean ± SEM. ns = not significant, *p < 0.05, **p < 0.01, ***p < 0.0001.

