FIGURE 2.
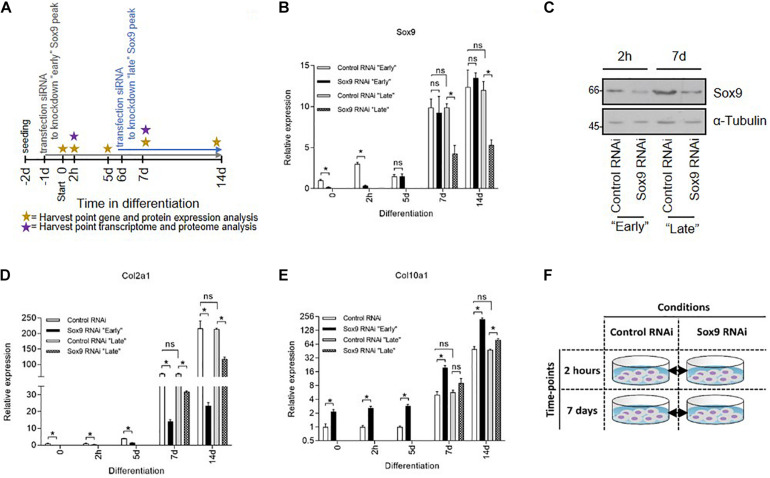
Elucidating the function of early Sox9 expression by transcriptome and proteome analyses. (A) Schematic representation of experimental setup for Sox9 knockdown experiment. Specific Sox9 RNAi (100 nM) or scrambled control RNAi (100 nM) were transiently transfected “early” at t = −1 day or “late” t = 6 day. ATDC5 cells were differentiated from day 0 onward and harvested for transcriptome and proteome analysis at t = 0, 2 h, 5 day, 7 day, and 14 day. (B) Sox9 mRNA expression during ATDC5 differentiation in Control and Sox9 RNAi conditions (h = hours, d = days) as measured by RT-qPCR. Results were normalized to β-Actin RNA expression and presented relative to t = 0. Bars represent mean ± SEM. ns = not significant, *p < 0.05, **p < 0.01, ***p ≤ 0.0001. (C) Sox9 protein expression at t = 2 h (for “early knockdown condition) and t = 7 day (for “late” knockdown conditions) time point in Control and Sox9 RNAi conditions as measured by immunoblotting. α–Tubulin was used as loading control. Molecular weight markers (in kDa) are shown on the left. (D) Col2a1 mRNA expression in similar samples from (B). (E) Col10a1 mRNA expression in similar samples from (B). (F) Schematic representation of time points and comparisons for transcriptomics and proteomics analysis.

