
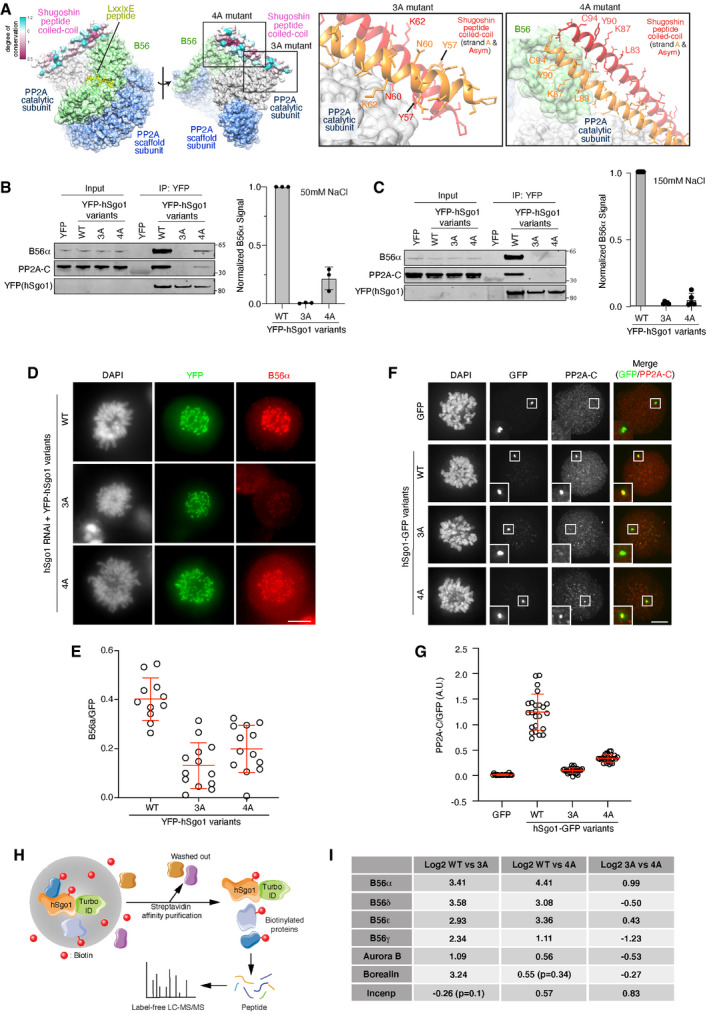
Figure 3. hSgo1 mutations in the coiled‐coil domain affect PP2A‐B56 binding.
-
AStructure of the reported PP2A‐B56γ‐hSgo1 binding interfaces and residues mutated in the hSgo1 3A and 4A mutants are shown. 3A refers to Y57A, N60A, and K62A mutations at the PP2A‐C binding interface. 4A refers to L83A, K87A, Y90A, and C94A mutations at the B56 binding interface of hSgo1.
-
B, CIP of YFP‐hSgo1 from cells stably expressing the hSgo1 WT, 3A, and 4A using different salt conditions (50 mM NaCl (B) or 150 mM (C)) followed by immunoblotting of indicated proteins and quantification by LI‐COR. Representative blots are shown. B56α signals were normalized to YFP and plotted. Error bars represent SD (n = 3 for B and n = 4 for C).
-
DLocalization of B56α in cells depleted of hSgo1 and expressing the indicated YFP‐hSgo1 variants. Representative immunofluorescent images are shown. Scale bar, 5 µm.
-
EB56α signal intensity was quantified. B56α signal from each cell was determined from 5 kinetochore pairs and normalized to YFP‐hSgo1 signal. Each circle represents an individual cell, and the average and SD are indicated.
-
FMitotic U2OS LacO Haspin CM cells expressing hSgo1‐LacI‐GFP variants or LacI‐GFP (control) were stained for PP2A‐C. Scale bar, 5 µm.
-
GPP2A‐C signal intensity was quantified, normalized to GFP, and then plotted. Each circle represents an individual cell, and the mean fluorescent intensity is indicated. Representative of at least 3 independent experiments.
-
HSchematic of the TurboID‐hSgo1 approach.
-
ITable summarizing the Log2 differences between hSgo1 WT, 3A and 4A.
Source data are available online for this figure.