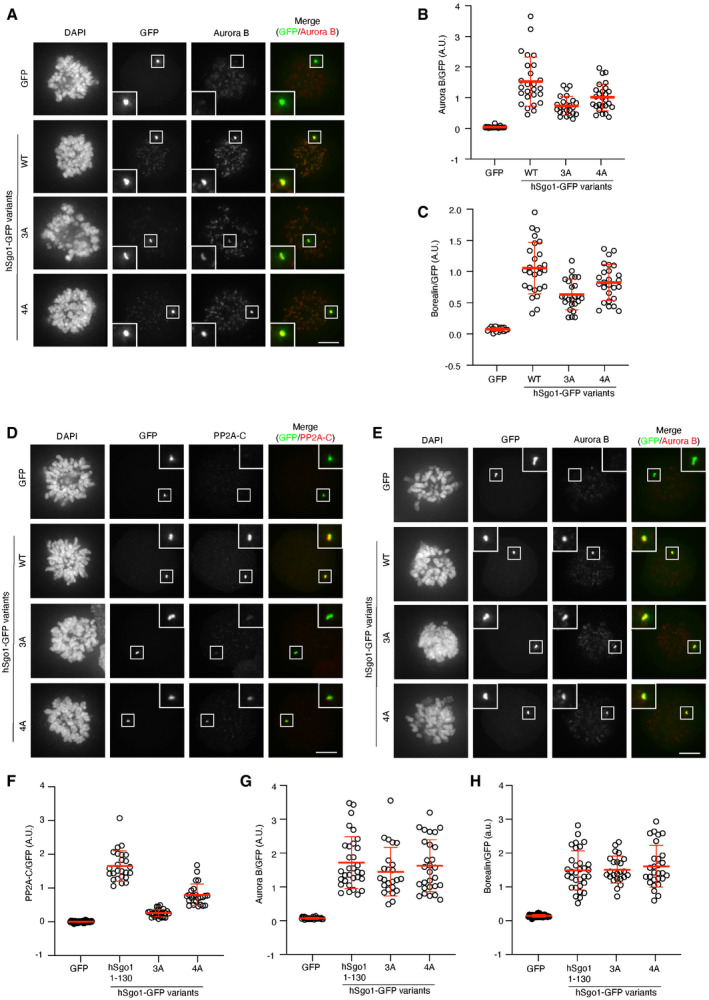
Figure EV3. Supporting information related to Fig 3F and G.

-
A–CMitotic U2OS LacO cells expressing hSgo1‐LacI‐GFP variants or LacI‐GFP (control) were stained for CPC components, Aurora B (A) and Borealin (not shown). AuroraB (B) and Borealin (C) signal intensity was quantified, normalized to GFP, and plotted. Each circle represents an individual cell, and the mean is indicated. Representative of at least 3 experiments.
-
D–HMitotic U2OS LacO cells expressing hSgo11–130‐LacI‐GFP variants or LacI‐GFP (control) were stained for PP2A‐C (D) or CPC components, Aurora B (E) and Borealin (not shown). PP2A‐C (F), AuroraB (G), and Borealin (H) signal intensity were quantified, normalized to GFP, and plotted. Each circle represents an individual cell, and the mean is indicated. Representative of at least 3 experiments.
Data information: Scale bars (in A, D–E), 5 µm.
Source data are available online for this figure.
