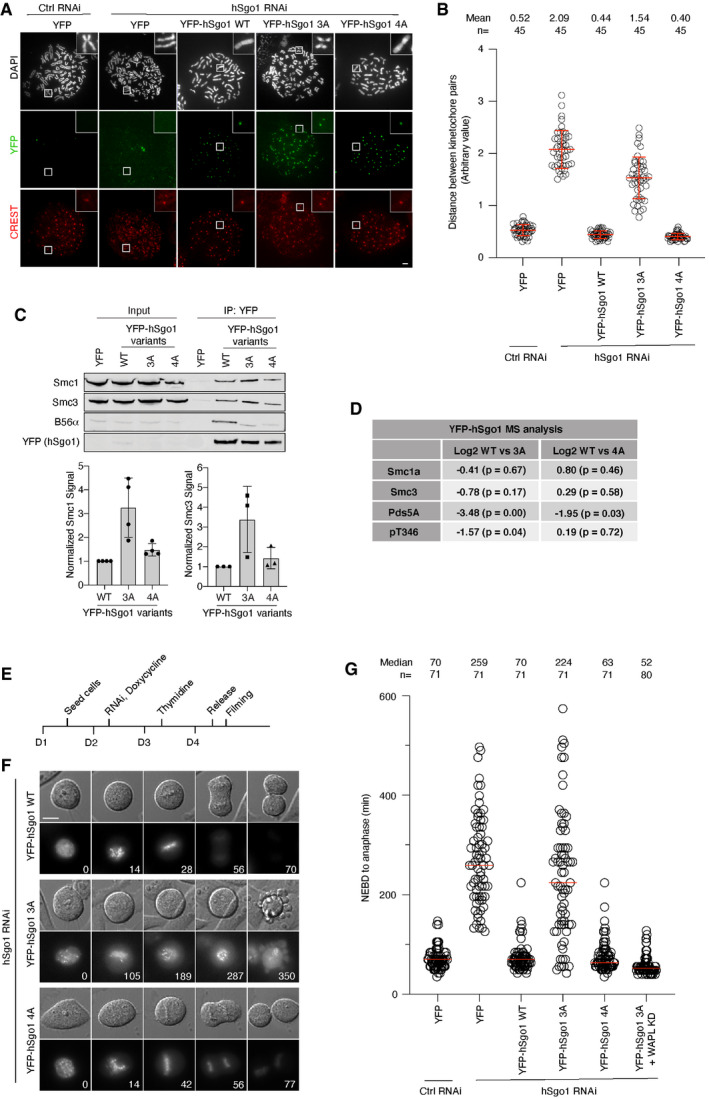
Figure 4. Cohesion protection in hSgo1 mutants.

- Representative images of chromosome spreads from hSgo1 RNAi treated cells stably expressing the indicated YFP‐hSgo1 variants. All the YFP‐hSgo1 rescue constructs (green) localize to the centromeres (CREST, red). Scale bar, 5 µm.
- The distance between the two peak intensities of CREST was measured for 5 kinetochore pairs from the chromosome spreads in (A) and averaged for a single cell. The data are from 3 independent experiments and the mean and SD are indicated.
- IP of YFP‐hSgo1 from cells stably expressing hSgo1 WT, 3A, and 4A followed by immunoblotting of cohesin components, Smc1 and Smc3. Representative blots are shown (top). Signals were quantification by LI‐COR, normalized to YFP and plotted (bottom). Error bars represent SD (n = 4 for Smc1 and n = 3 for Smc3).
- Table summarizing the Log2 differences between hSgo1 WT, 3A and 4A from quantitative MS analysis.
- Experimental protocol of the live cell imaging shown in (F).
- hSgo1 RNAi and rescue with the indicated hSgo1 RNAi‐resistant constructs was performed. Representative still images captured during the live cell imaging showing DIC and YFP‐hSgo1 WT, 3A, and 4A localization during mitosis. Time (min) from nuclear envelop breakdown (NEBD) is indicated. Scale bar, 15 µm.
- The time from NEBD to anaphase was measured from 3 independent live cell imaging experiments. Each circle represents an individual cell, and the median is indicated. Note that the WAPL KD condition is incorporated from the experiment which is shown in full in Fig EV4C for clarity.
Source data are available online for this figure.
