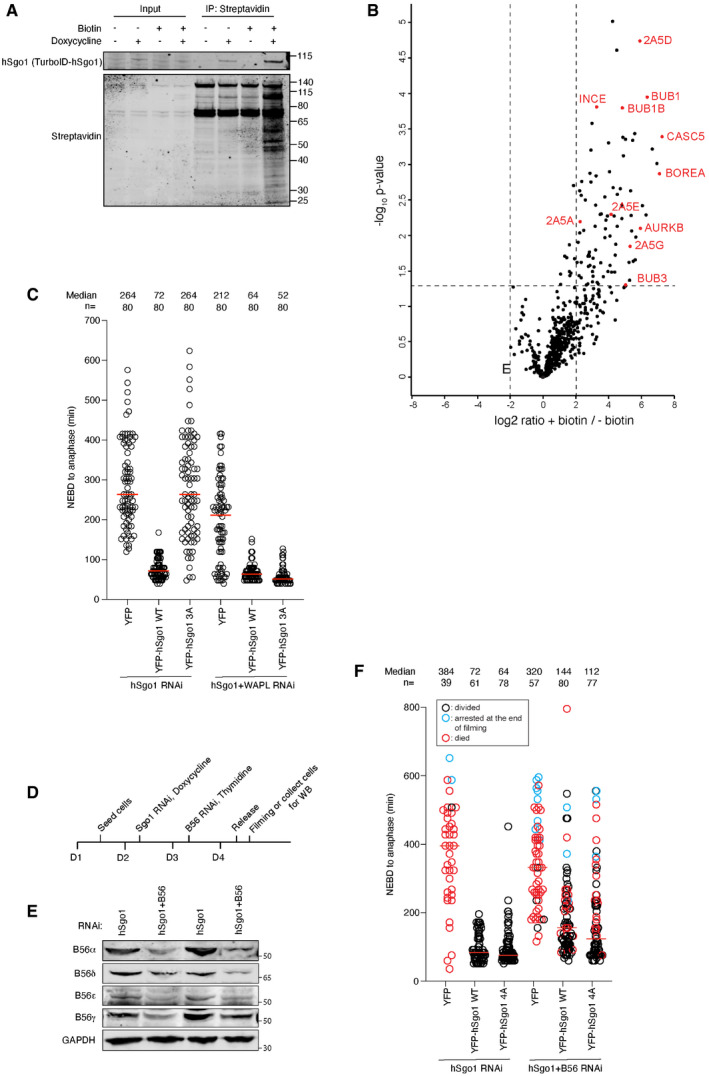
Figure EV4. Validation of TurboID system and hSgo1KD and rescue in various conditions.

- Blot of stable, doxycycline‐inducible TurboID‐hSgo1 cells treated with doxycycline and/or biotin as indicated, and probed for hSgo1 or Streptavidin.
- Volcano plot of TurboID‐hSgo1 WT cells treated or untreated with biotin. B56 regulatory subunits (2A5A‐E) and centromere as well as kinetochore proteins indicated (UniProt name indicated).
- hSgo1KD and rescue with the indicated hSgo1 RNAi‐resistant constructs ± WAPL KD were performed. The time from nuclear envelop breakdown (NEBD) to anaphase was measured from the live cell imaging. Each circle represents an individual cell. Note that the hSgo1 + WAPL RNAi condition is incorporated into Fig 4G for clarity.
- Experimental protocol of the live cell imaging with hSgo1 complementation with and without partial B56 depletion shown in (F).
- WB showing the partial KD of all B56 isoforms.
- hSgo1 ± partial B56 KD and rescue with the indicated hSgo1 RNAi‐resistant constructs were performed. The time from nuclear envelop breakdown (NEBD) to anaphase was measured from the live cell imaging. Each circle represents an individual cell. Blue circles indicate the cells that were still arrested at the end of filming, and red circles indicate the cells that died. The median is indicated with the red horizontal bars. Representative of 2 independent experiments.
Source data are available online for this figure.
