-
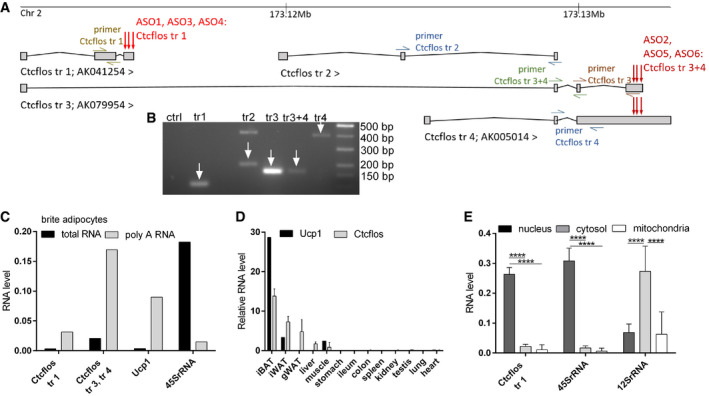
A
Ctcflos locus. Location and structure of annotated Ctcflos isoforms (Ensembl 99). Green, blue, and brown marks display primer‐binding sites; red arrows mark target areas of LNA Gapmer antisense oligos.
-
B
Gel picture of Ctcflos transcripts expressed in differentiated brite adipocytes amplified by polymerase chain reaction (PCR) using transcript‐specific primers.
-
C
Comparison of Ctcflos, Ucp1, and 45SrRNA transcript abundance in total RNA and poly‐A RNA fraction of primary differentiated brite adipocytes derived from 129S6 mice, assessed by qPCR, n = 1.
-
D
Relative transcript levels of Ctcflos and Ucp1 in various tissues of 129S6 mice, assessed by qPCR. Mean values ± SD, n = 1 (biological replicate) for Ucp1, n = 3 (biological replicates) for Ctcflos.
-
E
Ctcflos, 45SrRNA, and 12SrRNA transcript abundance in nuclear, cytosolic, and mitochondrial subfractions of primary brite adipocytes of 129S6 mice, assessed by qPCR. Mean values ± SD, n = 6 (biological replicates), two‐way ANOVA (Tukey test), ****P < 0.0001.