
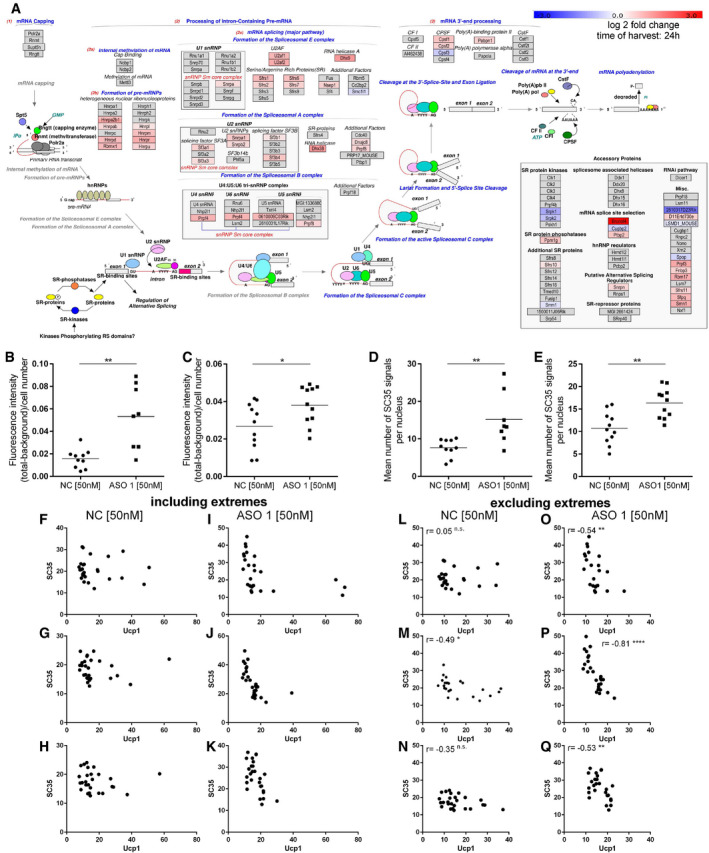
Figure EV4. Ctcflos KD‐dependent changes in the splicing machinery.
-
AExpression of splicing machinery components and splicing regulating factors from transcriptome profiling in response to Ctcflos tr1 (ASO 1) KD (KD on day 1 of differentiation), visualized by Path Visio software. Color code visualizes log2 fold change in gene expression 24 h after the KD.
-
B, CQuantification of SC35 fluorescence signal from immunocytochemistry as whole image fluorescence intensity subtracted by background and normalized to total cell number. Mean and individual values, n = 8–11 (technical replicates) the experiment was performed for a total of three times, for the third experiment see (Fig 6F), unpaired t‐test, *P < 0.05, **P < 0.01.
-
D, EQuantification of nuclear speckle number from immunocytochemistry as mean number of SC35 signals per nucleus. Mean and individual values, n = 8–11 (technical replicates) the experiment was performed for a total of three times, for the third experiment see (Fig 6G), unpaired t‐test, **P < 0.01.
-
F–QCorrelation of SC35 and UCP1 fluorescence signals in immunocytochemistry across individual cells in (F‐H, L‐N) control and (I‐K, O‐Q) Ctcflos tr1 (ASO 1) KD cells. (F‐K) Extreme values are included. (L‐Q) Extreme values were excluded to avoid distortion of correlation analysis. Additional three replicates to (Fig 6F and G). Pearson correlation, *P < 0.05, **P < 0.01, ****P < 0.0001.