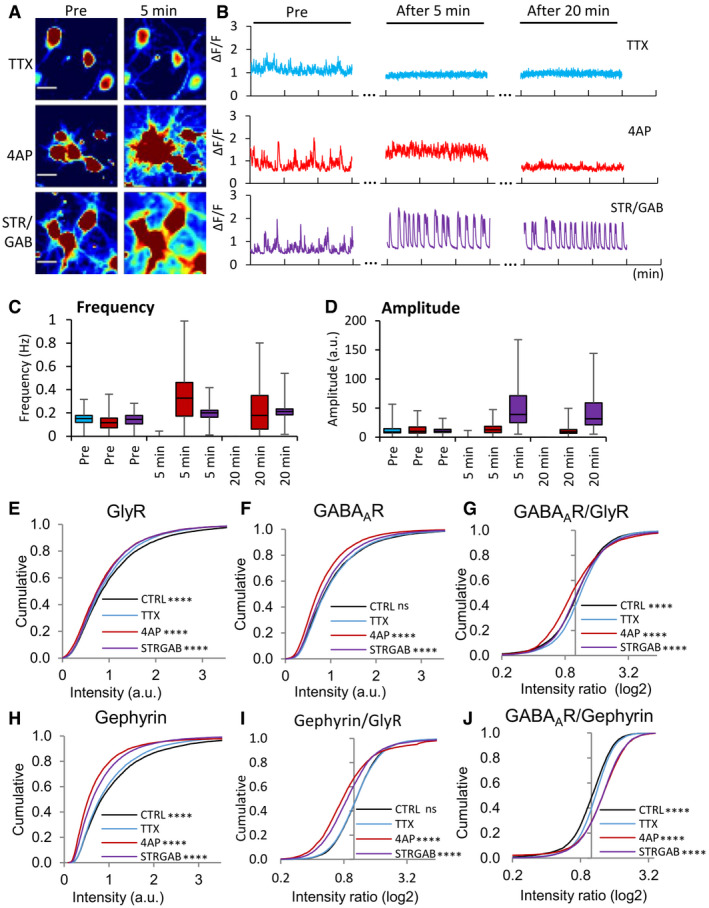
Figure EV3. Calcium imaging and immunocytochemistry (ICC) of cultured spinal cord neurons in response to changes in network activity.

-
ACalcium signals before treatment (pre) and after a 5‐min application of TTX (top), 4‐AP (middle), or strychnine/gabazine (bottom, false color). The brightness and contrast were adjusted to the same range across all the images. Note that cells active at baseline were chosen in order to better illustrate the effects of the treatments. Scale bar: 20 μm.
-
BMeasurement of calcium signals at the beginning of the recording (pre) and after 5 and 20 min of bath application of TTX (top, blue traces), 4‐AP (middle, red traces), or strychnine/gabazine (bottom, purple traces) to induce changes in neuronal network activity.
-
C, DQuantification of the amplitudes and frequency of the calcium signals. The amplitude was calculated as the average intensity of calcium transients per cell during the 3 min recordings. Before treatment (pre), baseline activity had a frequency of 0.15 ± 0.06 Hz/0.12 ± 0.07 Hz/0.14 ± 0.06 Hz, and an amplitude of 12.72 ± 9.21/12.34 ± 8.04/11.33 ± 5.25 (in cells treated with TTX, 4‐AP, and strychnine/gabazine, respectively). TTX blocked all neuronal activity, as judged by the lack of calcium signals after application. Five minutes after 4‐AP treatment, the frequency of calcium transients was greatly increased (0.33 ± 0.21 Hz, Friedman test with Dunn's post hoc test, P < 0.0001) and the amplitude was unchanged (14.56 ± 9.43, P = 0.31). On the other hand, 5 min strychnine/gabazine treatment increased both the frequency (0.20 ± 0.06, P < 0.0001) and the amplitude (52.68 ± 39.23, P < 0.0001). Number of cells: n = 117 for 4‐AP (red bars), n = 70 for TTX treatment (blue bars), n = 114 for strychnine/gabazine (purple bars), from three independent experiments, data are represented as box plots showing the median, 25 and 75% quartiles, as well as the minimum and the maximum of the population.
-
E–JDifferential regulation of GlyRs, GABAARs, and gephyrin through altered network activity. (E–G) Quantification of synaptic levels of GlyRs, GABAARs, and GABAAR/GlyR ratios using ICC. Some of these data are the same as in Fig 4 (TTX and 4‐AP treatment). (H) Treatment of cultured spinal cord neurons with 4‐AP strongly reduced gephyrin immuno‐labeling (KW test, P < 0.0001). Gephyrin was detected with mAb7a antibody that recognizes the phosphorylated S270 epitope of gephyrin. (I, J) Intensity ratios of gephyrin/GlyR and GABAAR/gephyrin, showing their relative changes at the same synapses (KW test, P < 0.0001 in I and J). The control (CTRL) condition was without any pharmacological treatment. Number of synapses: n = 9,416 in TTX (blue traces), n = 6,949 in 4‐AP (red), n = 8,856 in CTRL (black), n = 8,150 in strychnine/gabazine conditions (purple) from three independent experiments. KW test/Dunn's test, P values indicate the comparison to the TTX condition. ns: not significant, ****P < 0.0001.
Source data are available online for this figure.
