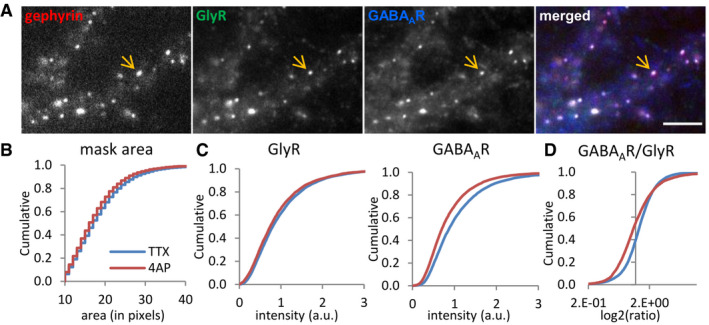
Figure 4. Reduced GABAAR levels but not GlyRs at mixed inhibitory synapses by 4‐AP treatment.

- Triple immuno‐labeling of gephyrin, GlyRs, and GABAARs at mixed inhibitory synapses (arrow) imaged with conventional fluorescence microscopy. Scale bar: 5 µm.
- Quantification of the apparent synaptic area (in pixels) of gephyrin clusters (KS test P < 0.0001).
- Lower fluorescence intensity of GABAARs but only a minor reduction of GlyRs at synaptic gephyrin clusters (KS test, P < 0.0001, both panels).
- Reduced GABAAR/GlyR intensity ratio at mixed inhibitory synapses (KS test, P < 0.0001). Number of synapses: n = 9,416 in TTX and n = 6,949 in 4‐AP conditions from three independent experiments.
Source data are available online for this figure.
