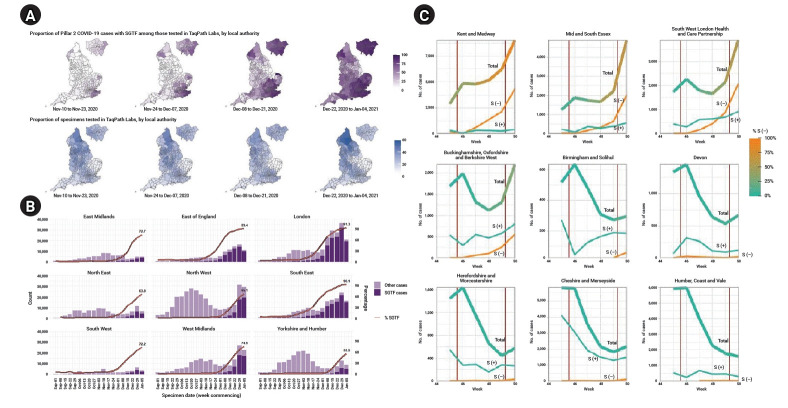
Fig. 2.
Weekly trend of S gene target failure (SGTF) cases in England. (A) Mapping of proportion of SGTF and specimens tested in TaqPath in England by weeks (extracted from Chand et al. [9]). (B) Proportion of SGTF cases tested in TaqPath Labs in England by region and week (extracted from Chand et al. [7]). (C) Weekly trend of number of cases by SGTF group (S−) and non-SGTF group (S+) in several areas (thick line, total cases; yellow line, S− cases; thin greenish line, S+ cases) (extracted from Volz et al. [12]).

