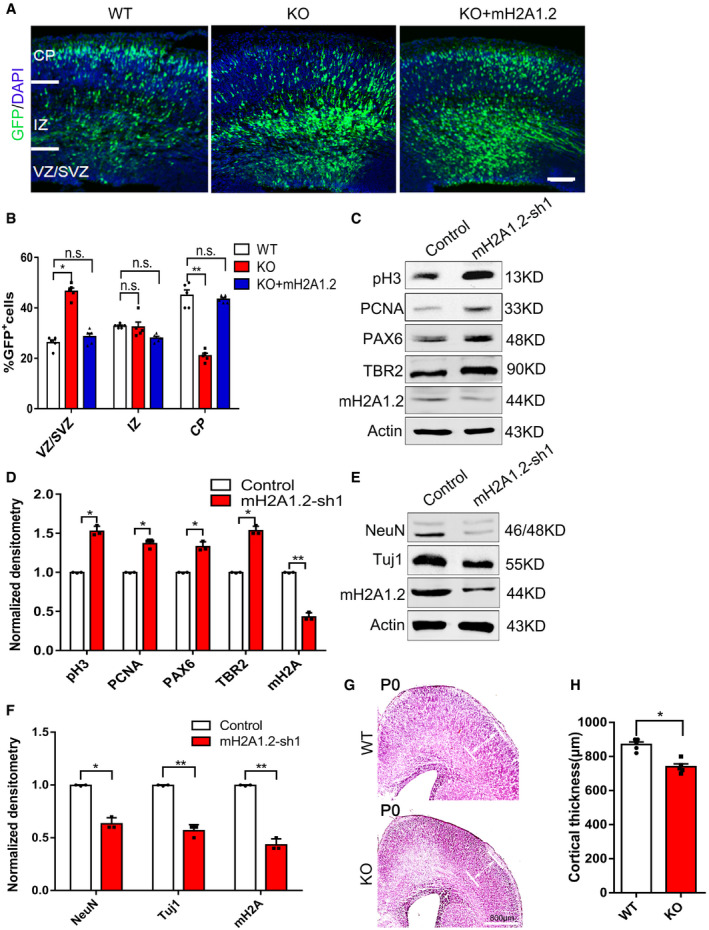
Figure EV4. mH2A1.2 knockdown affects proliferation and differentiation of neural progenitor cells.

- Representative images of E16.5 cortices electroporated with GFP into WT and KO brain and GFP+mH2A1.2 into mice at E13.5, the mouse was sacrificed at E16.5. Scale bar represents 50 μm.
- Graphs of the percentage of GFP+ cells in the VZ/SVZ, IZ, and CP. Overexpression of mH2A1.2 restored the distribution of GFP+ cells to the normal state. n = 5 mice, independent replicates.
- Western blot analysis reveals that the expression levels of the neural stem cell markers, including pH3, PCNA, PAX6, TBR2, and mH2A1.2, are increased in the mH2A knockdown NSCs versus the control.
- Statistics of the normalized density of pH3, PCNA, PAX6, TBR2, and mH2A1.2. n = 3 mice, independent replicates.
- Western blot analysis reveals that the expression levels of the neuron markers NeuN, Tuj1, and mH2A1.2 are downregulated in mH2A1.2 knockdown NSCs versus the control.
- Statistics of the normalized density of NeuN, TUJ1, and mH2A1.2. n = 3 mice, independent replicates.
- Representative images of mH2A1.2 WT and KO cortex at newborn (P0) by hematoxylin and eosin stain (H&E) staining. Reduced cortical thickness is observed in KO cortex. CP: cortical plate. Scale bar = 800 μm.
- Quantification of the cortical thickness in mH2A1.2 WT and KO cortex. Reduced cortical thickness is observed in KO cortex. n = 5 mice, independent replicates.
Date information: Representative images from at least three independent experiments. Error bars represent means ± S.E.M.; two‐tailed unpaired t‐test, *P < 0.05, **P < 0.01. n.s., not significant.
