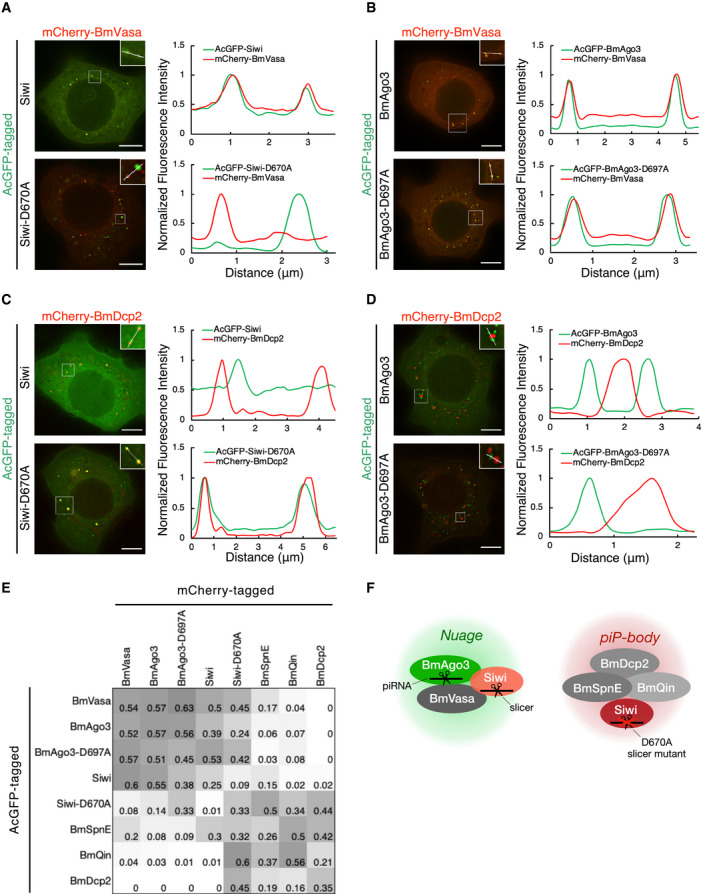
Figure 1. Cytoplasmic compartmentalization of the silkworm piRNA pathway.

-
A, BColocalization of AcGFP‐Siwi, AcGFP‐BmAgo3, and mCherry‐BmVasa in BmN4 cells. Line scans (white line in the enlarged region) show that Siwi‐D670A mutant but not BmAgo3‐D697A mutant dissociates from BmVasa foci. Line scans of fluorescence intensity were normalized to the highest value and depicted at the right panel. Scale bar, 8 μm.
-
C, DColocalization of AcGFP‐Siwi, AcGFP‐BmAgo3, and mCherry‐BmDcp2 in BmN4 cells. Line scans (white line in the enlarged region) show that Siwi‐D670A mutant but not BmAgo3‐D697A mutant overlaps with BmDcp2 foci. Line scans of fluorescence intensity were normalized to the highest value and depicted at the right panel. Scale bar, 8 μm.
-
EHeatmap of colocalization ratio between fluorescence protein‐tagged piRNA factors. Each colocalization ratio is quantified by using ImageJ plugin Comdet (see Materials and Methods) and averaged from n = 3 independent z‐stacks. Darker color represents more frequent colocalization. Known nuage proteins (BmVasa, BmAgo3, Siwi) form a cluster at the top‐left corner. Siwi‐D670A mutant, but not BmAgo3‐D697A, clusters with BmSpnE, BmQin, and BmDcp2 at the bottom‐right corner, representing piP‐bodies. See also Figs EV1 and EV2.
-
FSchematic diagram showing the proposed spatial compartmentalization of the BmN4 piRNA pathway. Nuage components: BmVasa, BmAgo3, Siwi; piP‐body components: BmSpnE, BmQin, and BmDcp2. Siwi‐D670A mutation leads to the accumulation of the mutant itself in piP‐bodies and colocalization with BmSpnE and BmQin. See also Fig EV1.
