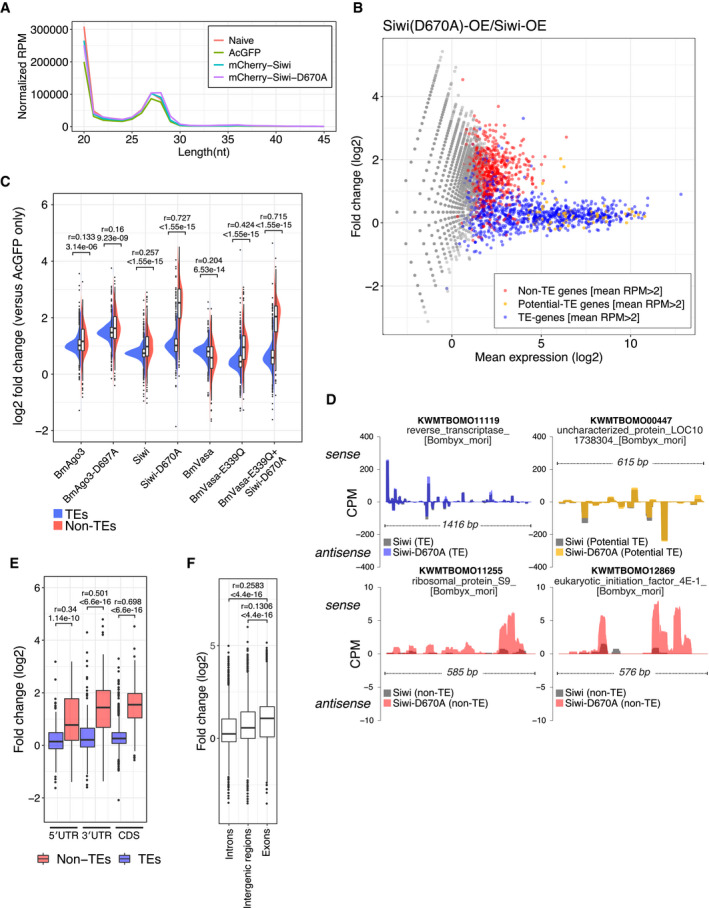
Figure 5. Disrupted nuage/piP‐body partitioning causes mis‐production of mRNA‐derived piRNAs.

- Length distribution of total small RNAs from BmN4 cells overexpressed with AcGFP, mCherry‐Siwi or mCherry‐Siwi‐D670A. Two peaks (20‐nt and 27‐nt) correspond to siRNA/miRNA and piRNA, respectively.
- MA plot of differential piRNA expression analysis between Siwi‐D670A and Siwi overexpressed libraries. Each dot represents the mapped piRNA (> 25‐nt) on a predicted silkworm gene. Predicted CDSs with mean RPM > 2 between two independent naive libraries were categorized into non‐TE genes (red), potential‐TE genes (orange), and TEs (blue) (see also Fig EV4A and Materials and Methods). Siwi‐D670A overexpression upregulates non‐TE gene‐derived piRNAs while TE‐derived piRNAs are not affected. See also Figs EV4 and EV5.
- Split violin plots of piRNA expression fold change between AcGFP (control) and piRNA factor(s) overexpressed libraries. Overexpression of Siwi‐D670A, BmVasa‐E339Q and both mutants increase non‐TE‐derived piRNA (red, 626 genes) while TE‐derived piRNA (blue, 818 genes) does not change. Bonferroni‐corrected P‐values and the effect sizes (r) were calculated by asymptotic Wilcoxon rank sum test.
- Normalized coverage per million (CPM) of mapped piRNA reads (> 25‐nt) on the CDS region of 4 representative genes. Colored areas represent reads from Siwi‐D670A‐overexpressed library, and the gray areas represent reads from wild‐type Siwi‐overexpressed library. (Top) piRNA reads mapped to both sense and antisense directions on a TE gene (putative reverse transcriptase) and a potential TE gene (uncharacterized protein) with similar RPM between the two libraries. (Bottom) piRNA reads mapped to the sense direction on non‐TE genes (ribosomal protein S9 and eIF4E‐1) with elevated RPM in the Siwi‐D670A library. Elevated peaks appear to spread around the pre‐existing peaks on these genes in the wild‐type library.
- Fold changes of piRNA expression levels in UTRs and CDS between Siwi‐D670A and Siwi overexpressed libraries. Non‐TE‐derived piRNAs are similarly upregulated across 5′ UTR (non‐TE: 105 genes, TE: 274 genes), CDS (non‐TE: 628 genes, TE: 811 genes), and 3′ UTR (non‐TE: 126 genes, TE: 257 genes). Bonferroni‐corrected P‐values were calculated by asymptotic Wilcoxon rank sum test.
- Fold changes of piRNA expression levels in introns (15,065 annotated regions), intergenic regions (11,124 annotated regions), and exons (10,177 annotated regions) between Siwi‐D670A and Siwi overexpressed libraries. Only exon‐derived piRNAs are upregulated by Siwi‐D670A overexpression, suggesting that the process is strictly cytoplasmic. Bonferroni‐corrected P‐values and the effect sizes (r) were calculated by asymptotic Wilcoxon rank sum test.
Data information: (C, E, F) Box plots: Centre line, median; box limits, lower (Q1), and upper (Q3) quartiles; whiskers, 1.5 × interquartile range (IQR); points, outliers.
