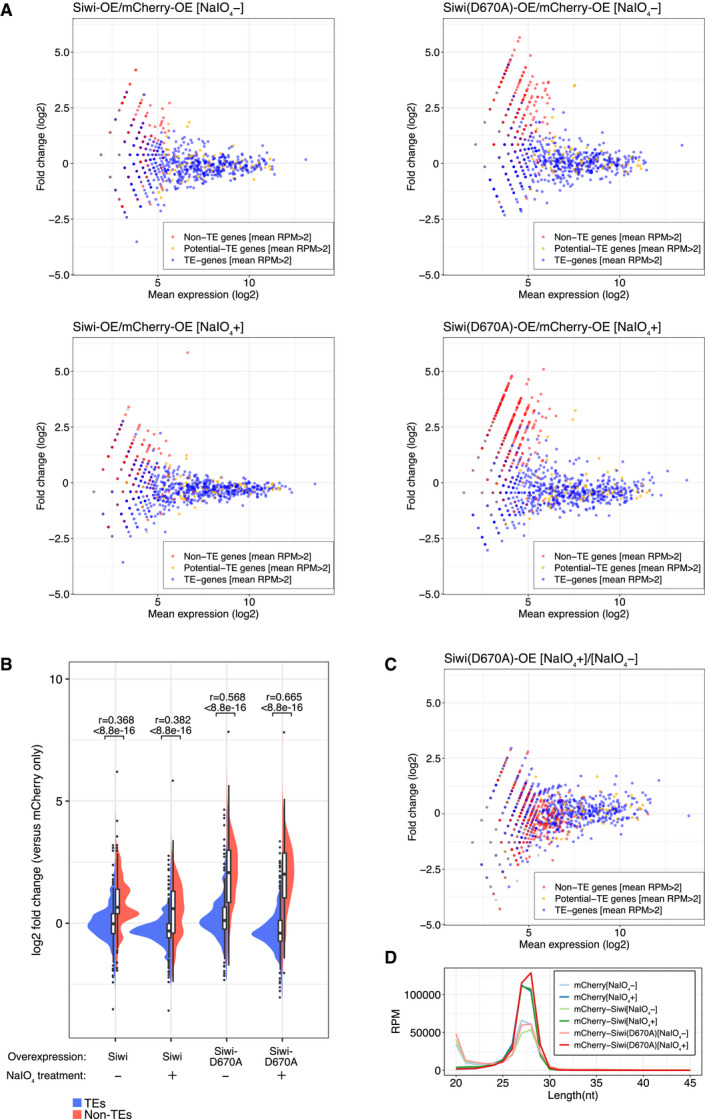
MA plots of differential piRNA expression analysis of Siwi/Siwi‐D670A‐ overexpressed (OE) cells against mCherry‐OE cells. Reads longer than 25‐nt are mapped to predicted genes (Silkbase GeneModel) and non‐TE genes derived reads are upregulated only in Siwi‐D670A‐OE cells. NaIO4 treatment did not deplete the upregulation.
Split violin plots of piRNA expression fold change between mCherry (control) and Siwi (WT/D670A) overexpressed libraries with or without NaIO4 treatment. Non‐TE piRNAs (red, 628 genes) upregulated or TE piRNAs (blue, 811 genes) remained unchanged in Siwi‐D670A‐OE cells have a similar distribution and mean value regardless of NaIO4 treatment. Bonferroni‐corrected P‐values and the effect sizes (r) were calculated by asymptotic Wilcoxon rank sum test. Box plot: Centre line, median; box limits, lower (Q1), and upper (Q3) quartiles; whiskers, 1.5 × interquartile range (IQR); points, outliers.
MA plot of NaIO4 + against NaIO4 – small RNA libraries from Siwi‐D670A‐OE cells. A mild depletion of the less abundant piRNAs is observed similarly with TE, potential TE and non‐TE piRNAs.
Length distribution of mCherry‐, Siwi‐, and Siwi‐D670A‐OE cells (± NaIO4 treatment). Two peaks (20‐nt and 27‐nt) correspond to siRNA/miRNA and piRNA respectively. The first peak (20‐nt) is depleted after NaIO4 treatment, leading to an increase of the read counts of the piRNA peak (27‐nt) in those libraries.

