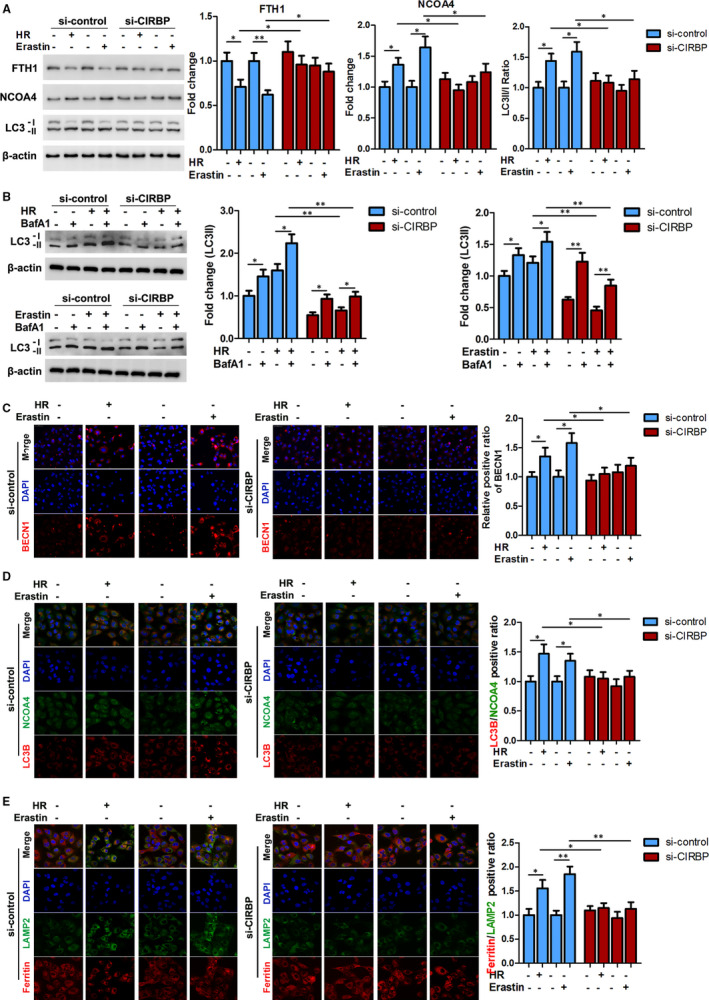
FIGURE 3.

CIRBP‐enhanced ferroptosis is associated with ferritinophagy activation in HK2 cells. HK2 cells were transfected with CIRBP siRNA or control vector and then treated with hypoxia for 6 h and reoxygenation for 12 h (H6R12) or erastin (10 μmol/L, 24 h). A, Protein levels of FTH1, NCOA4, and LC3II/I were determined by western blotting; representative blots (left panel) and quantification (right panel) are shown. B, Representative immunoblotting and quantification data for LC3 II in the treated HK2 cells together with bafilomycin A1 (BafA1, 10 nmol/L) treatment. C, Representative immunofluorescence images of BECN1. Scale bar, 50 μm. D, Representative double‐immunofluorescence images of LC3B (red) and NCOA4 (green) by confocal microscopy. Magnification, 600×. Nuclei were stained with DAPI (blue). E, Representative double‐immunofluorescence images of ferritin (red) and LAMP2 (green) by confocal microscopy. Magnification, 600×. Nuclei were stained with DAPI (blue). Values are expressed as means ± SD. n = 3, *P < .05, **P < .01
