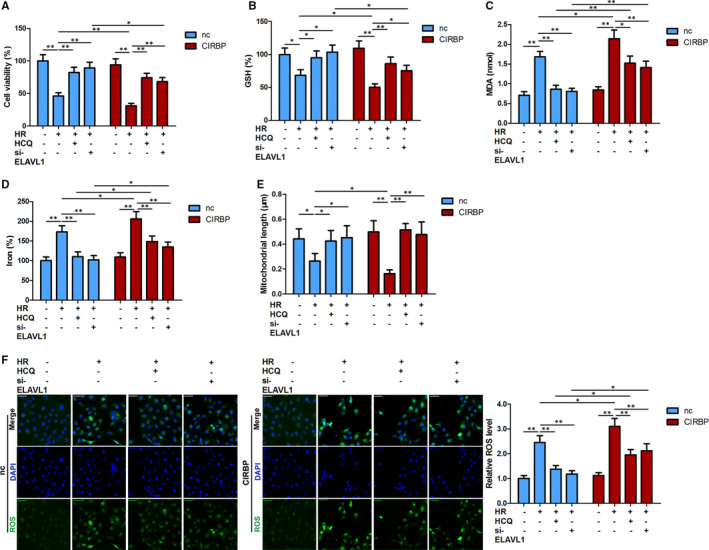
FIGURE 6.

Ferritinophagy inhibition disrupted CIRBP‐enhanced ferroptosis. Cell viability (A), and ferroptosis associated markers, GSH, MDA content, iron, (B‐D) and ROS levels (F) were assayed in the indicated HK‐2 cells. E, Mitochondrial length was determined under transmission electron microscopy. Values are expressed as means ± SD. n = 3, *P < .05, **P < .01
