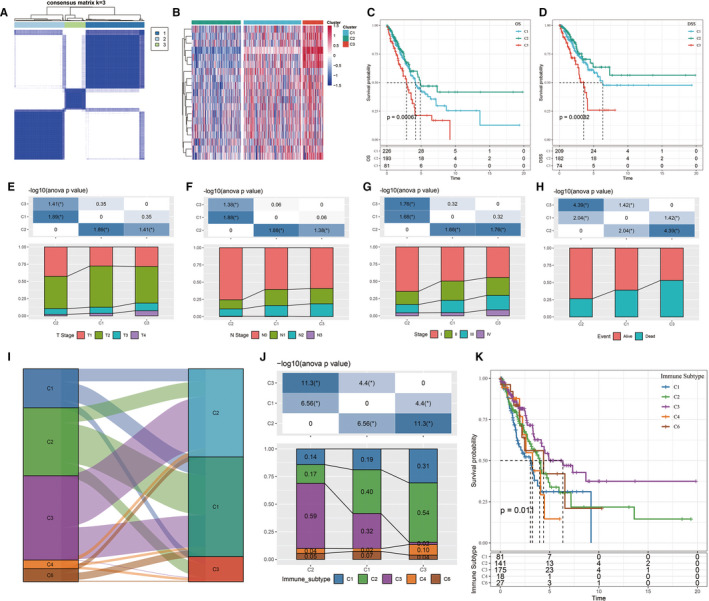
FIGURE 2.

A, Cluster thermograms of samples with consistent clusters of k = 3. B, Cluster thermograms of prognosis‐related invasion genes. C, Survival curves of TCGA lung adenocarcinoma samples with different molecular subtypes. D, TCGA lung adenocarcinoma samples according to different molecular subtypes. E‐H, Distribution comparison of clinical features among the 3 subtypes of the TCGA data set. I, Sanki map of molecular subtypes compared with existing molecular immune subtypes. J, Distribution of molecular subtypes compared with existing immune subtypes. K, Survival curves of the molecular immune subtypes
