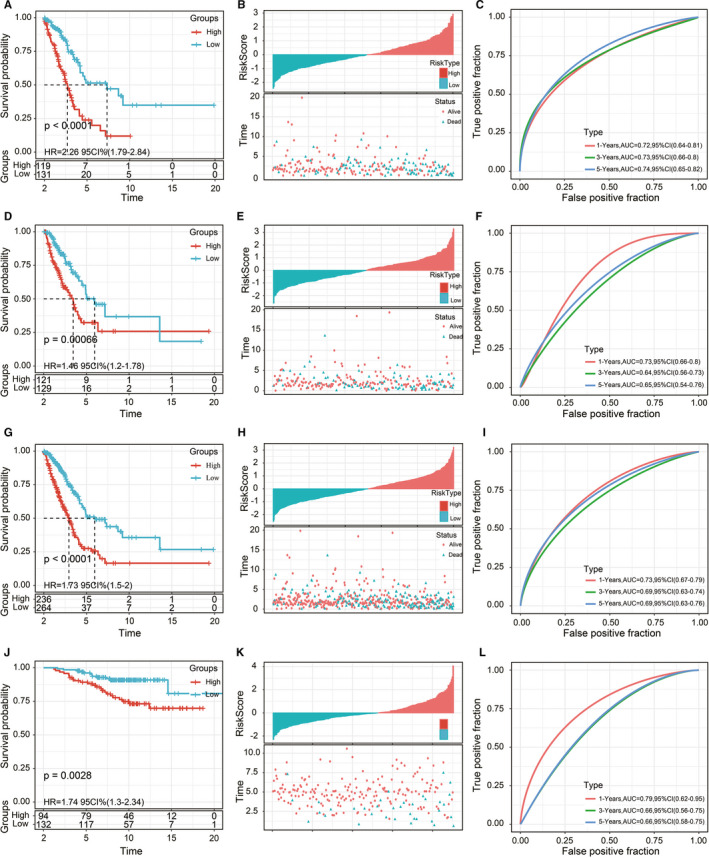
FIGURE 4.

A, Survival curves between the 2 risk groups based on the 5‐gene signature classification. B, Distributions of risk scores and survival status based on the 5‐gene signature in the TCGA training cohort. C, ROC curve of the 5‐gene signature classification in the TCGA training cohort. D‐F, Survival curves between the 2 risk groups, distributions of risk scores and survival status, and the ROC curve of the 5‐gene signature in the TCGA testing cohort. G‐I, Survival curves between the 2 risk groups, distributions of risk scores and survival status, and the ROC curve of the 5‐gene signature in the entire TCGA cohort. J‐L, Survival curves between the 2 risk groups, distributions of risk scores and survival status, and the ROC curve of the 5‐gene signature in the GSE31210 cohort
