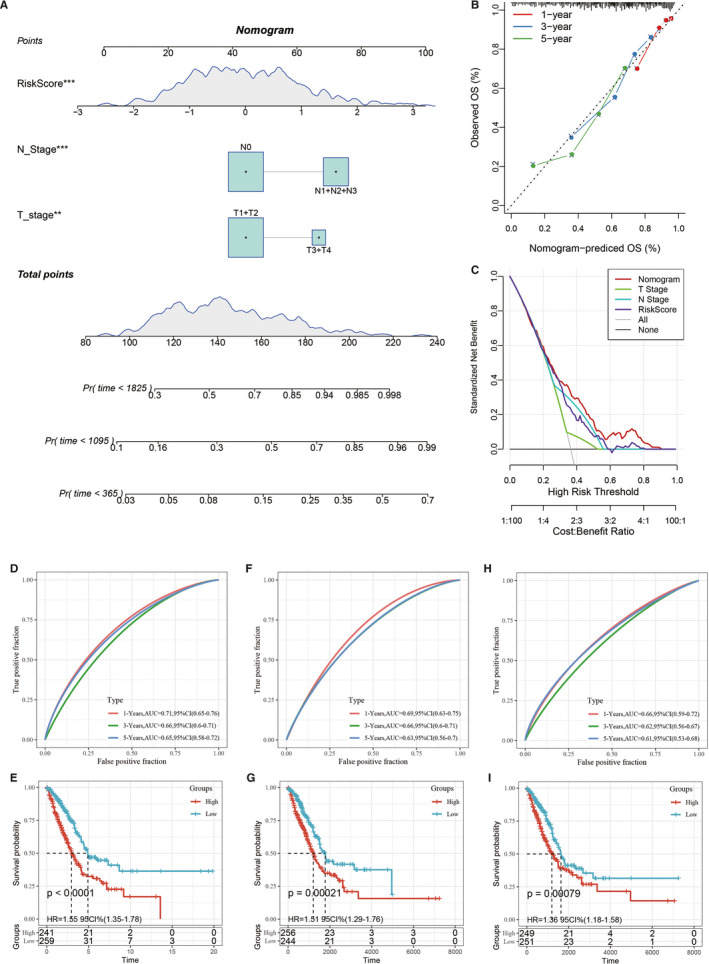
FIGURE 6.

A, Construction of the nomogram model. B, Calibration curves at 1, 3 and 5 years using the nomogram. C, Decision curve analysis of age, M stage, clinical stage, risk score and nomogram results. D‐E, ROC curve of the 8‐gene signature risk model (Li) and the Kaplan‐Meier curves of the high‐ and low‐risk LUAD samples. F‐G, ROC curve of the 3‐gene signature risk model (Yue) and the Kaplan‐Meier curves of the high‐ and low‐risk LUAD samples. H‐I, ROC curve of the 3‐gene signature risk model (Liu) and Kaplan‐Meier curves of the high‐ and low‐risk LUAD samples
