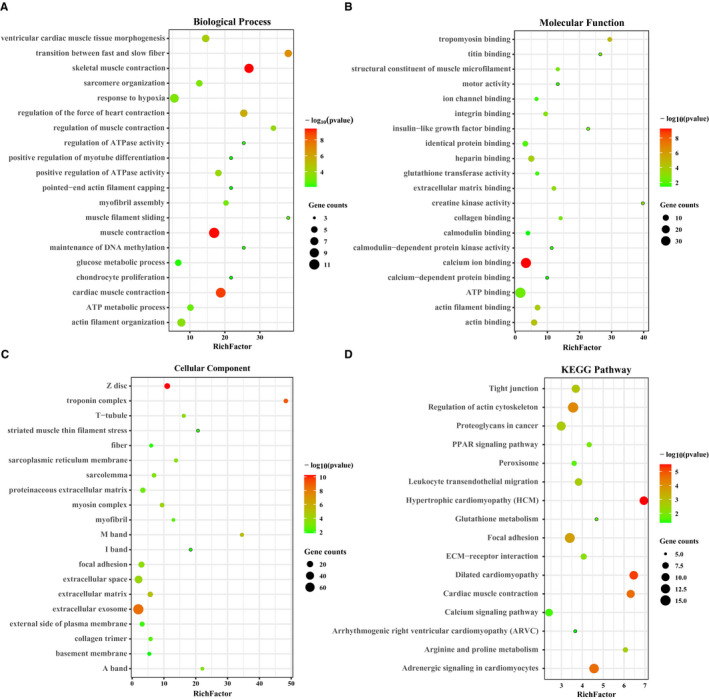
FIGURE 4.

GO and KEGG analysis of differential expressed proteins. GO and KEGG analysis of differential expressed proteins were performed using DAVID. The enrichment items or pathways were filtered with P < .05. Only the top 20 items or pathways with the most significant enrichment were displayed using R 3.63 software
