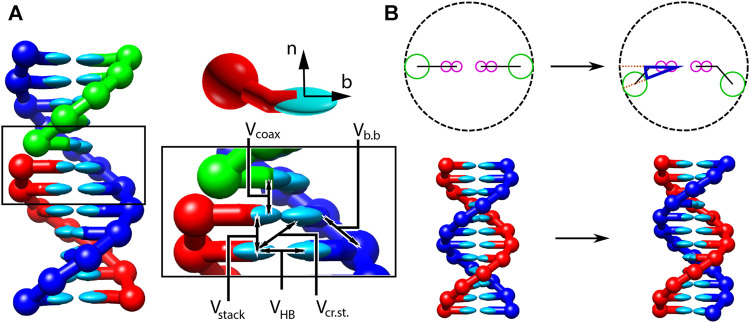
FIGURE 1.
Structure and interactions of the oxDNA model (adapted from (Snodin et al., 2015; Doye et al., 2020). (A) Three strands forming a nicked duplex as represented by oxDNA2.0, with the central section of the complex illustrating key interactions from Eq. 2 highlighted. Individual nucleotides have an orientation described by a vector normal to the plane of the base (labelled n), and a vector indicating the direction of the hydrogen bonding interface (labelled b). (B) Comparison of structure in oxDNA1.0 and oxDNA1.5 vs oxDNA2.0. In the earlier version of the model, all interaction sites are co-linear; in oxDNA2.0, offsetting the backbone site allows for major and minor grooving.

