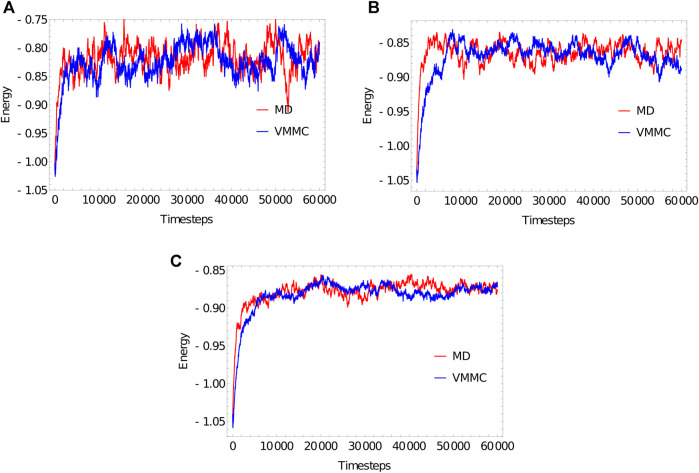
FIGURE 3.
Equilibration plots for the ploy (dT) molecules with (A) 20 bases, (B) 100 bases, (C) 1,000 bases, obtained as averages over 20 independent simulations. For both MD and VMMC, the potential is plotted as a function of simulation progress, in units of reduced time (3.03 ps) for MD and attempted steps per particle for VMMC.

