FIGURE 4.

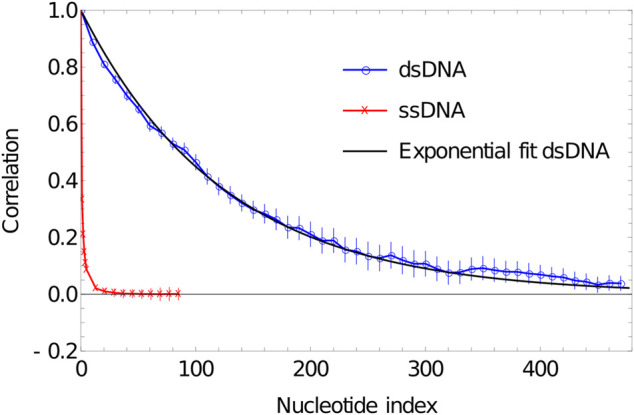
Plot of correlation of inter-segment vectors vs distance (number of base pairs along the DNA) for 500 dsDNA (blue curve) and 100 ssDNA (red curve). dsDNA fitted with an exponential decay with a decay constant of 0.0076134.

Plot of correlation of inter-segment vectors vs distance (number of base pairs along the DNA) for 500 dsDNA (blue curve) and 100 ssDNA (red curve). dsDNA fitted with an exponential decay with a decay constant of 0.0076134.