Fig. 1.
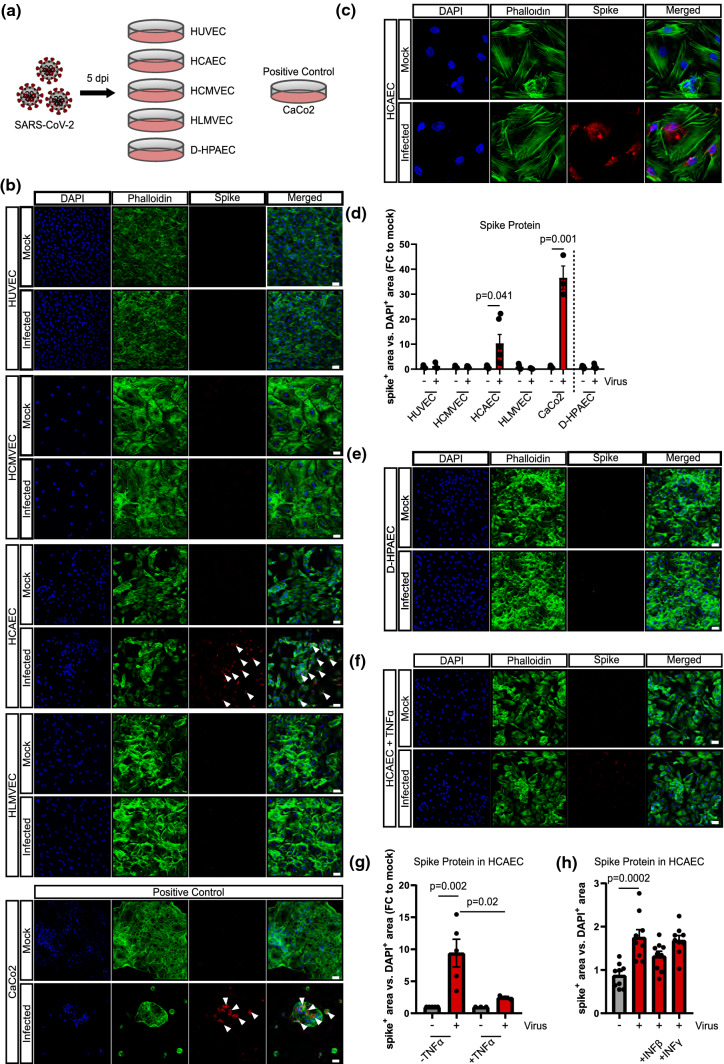
Human coronary artery endothelial cells are permissive for SARS-CoV-2. a Schematic experimental setup. b Human umbilical vein endothelial cells (HUVEC), human coronary artery endothelial cells (HCAEC), human cardiac microvascular endothelial cells (HCMVEC), and human lung microvascular endothelial cells (HLMVEC) were commercially purchased and were infected with SARS-CoV-2 (MOI = 1) for 2 h. Cells were cultured for 5 days. Human colon carcinoma cells (CaCo2) were used as positive control and harvested after 1 day. Spike protein (red) was detected using the rabbit-SARS-CoV-2 Spike primary antibody (indicated by white arrows) and cells were counterstained for DAPI (blue) and phalloidin (green). c Representative high magnification image of HCAECs experiments shown in b. d Quantification of data shown in B (n = 6 for HCAEC, n = 3 all other ECs). e Human lung pulmonary arterial cells isolated from diabetics (D-HPAEC) were commercially purchased and were infected with SARS-CoV-2 (MOI = 1) for 2 h. Cells were cultured for 5 days. Spike protein (red) was detected using the rabbit-SARS-CoV-2 Spike primary antibody and cells were counterstained for DAPI (blue) and phalloidin (green). n = 3. f HCAEC were treated with 30 ng/mL TNFα prior to SARS-CoV-2 inoculation (as described for panel b) n = 3. Cells were cultured for 5 days. Spike protein (red) was detected using the rabbit-SARS-CoV-2 Spike primary antibody and cells were counterstained for DAPI (blue) and phalloidin (green). g Quantification of data shown in b and f. h HCAEC were infected with SARS-CoV-2 isolates in the presence and absence of 10 ng/ml human recombinant interferon beta (IFNβ) or interferon gamma (IFNγ). Cells were cultured for 5 days and fixed with 4% PFA. Spike protein (red) was detected using the rabbit-SARS-CoV-2 Spike primary antibody (provided by Hölzel) and cells were counterstained for DAPI (blue) and phalloidin (green). Data are shown as mean and error bars indicate the standard error of the mean (SEM). After passing normality tests, data were statistically accessed using an unpaired, two-tailed T test to compare mock treated cells to their respective infected counterpart (d) or using a one-way ANOVA test with a post hoc Turkey’s test (g, h). Scale bars = 50 µm

