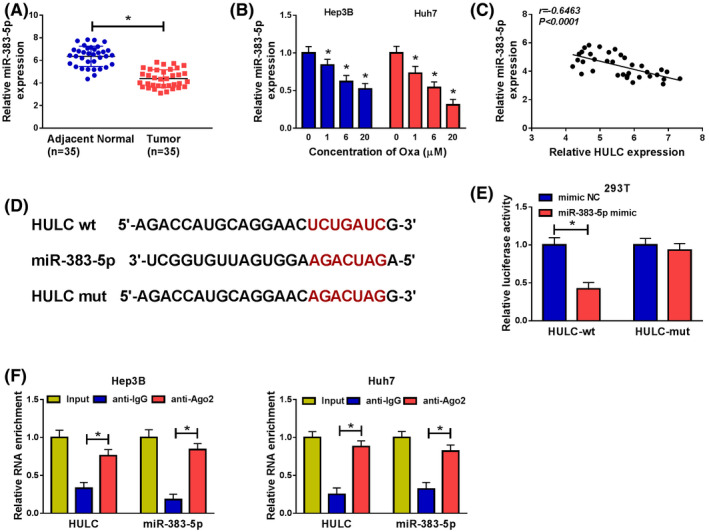
FIGURE 3.

HULC directly interacted with miR‐383‐5p. (A) The abundance of miR‐383‐5p was measured by qRT‐PCR in adjacent normal tissues and HCC tissues (t‐test). (B) The level of miR‐383‐5p was evaluated by qRT‐PCR in Hep3B and Huh7 cells treated with different concentrations of Oxa (t‐test). (C) The correlation between HULC and miR‐383‐5p was analyzed in HCC tissues. (D) Predicted binding sites between HULC and miR‐383‐5p are shown. (E) The luciferase activity was measured in 293T cells co‐transfected with HULC‐wt or HULC‐mut or and miR‐383‐5p mimic or mimic NC (t‐test). (F) The enrichment of HULC or miR‐383‐5p was detected by RIP assay in Hep3B and Huh7 cells incubated with anti‐Ago2 or anti‐IgG (ANOVA). *p < .05. ANOVA, analysis of variance; HCC, hepatocellular carcinoma; HULC, highly upregulated in liver cancer; NC, negative control; qRT‐PCR, quantitative real‐time polymerase chain reaction
