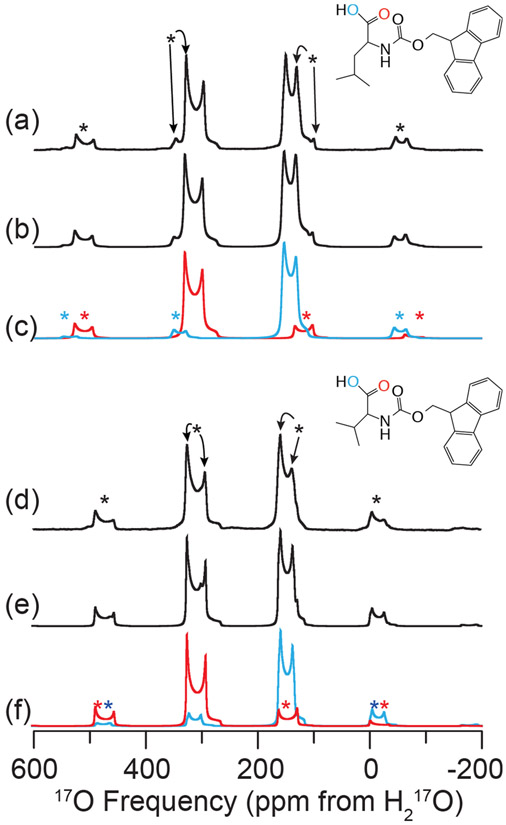
Figure 1.
Experimental and simulated 17O MAS NMR of FMOC-l-leucine (a–c) and FMOC-l-valine (d–f) at 21.1 T (ω0H/2π = 900 MHz). Experimental 17O MAS NMR (a,d), full spectral simulations (b,e), and simulations of each individual oxygen environment, CO (red) and COH (blue) (c,f) are shown. The line structures of FMOCL-l-leucine (inset above (a)) and FMOC-l-valine (inset above (d)) indicating the oxygen environments of interest are displayed. Spectra were acquired with ωR/2π = 24 (FMOC-l-leucine) or 20 (FMOC-l-valine) kHz, with spinning sidebands noted by asterisks (*). NMR parameters used in spectral simulations are given in Table 4.

